
There is no doubt that content marketing is evolving and therefore how we measure performance needs to adapt accordingly. This article reviews essential performance metrics you need to monitor, including long-standing measures as well as new ones shaped by AI-driven search.
What is content performance?
Content performance simply measures how well digital content, like blog posts, product and service pages, case studies and video, engages with your audience.
To accurately gauge content performance, marketers monitor key metrics like bounce rate, conversion rate and page views, often using a tool such as Google Analytics.
The nature of your business will determine which metrics are important to accurately evaluate your online content performance.
For example, an e-commerce website will more likely focus on metrics like conversion and cart abandonment rate.
In contrast, if the primary purpose of your content is to inform the user, then average engagement time and social likes and shares may be more appropriate measures of success.
Why is it important to monitor content performance?
Great online content should meet the needs of the target audience — often referred to as ‘meeting search intent’ in SEO. But how do we really know if our content does that and whether it’s ‘great’
Monitoring content performance is vital for businesses because it transforms data into actionable insights that drive business growth, team efficiency, and audience engagement.
Tracking helps determine if business goals, like conversions, lead generation, or brand awareness, are met. By analysing key metrics like users, engagement, and conversion rates, businesses can calculate their return on investment (ROI) and identify which content types yield the best results, and which require greater attention.
Crucial metrics for content success
There are many different metrics you can track, and the ones that define your success will depend on your business’s unique needs. Below, we highlight the common metrics used to evaluate content performance.
Engagement metrics
Engagement metrics measure how users interact with digital content, using indicators like page views and bounce rate to evaluate user interest. These insights help to assess how effectively your website content captures and retains the attention of the audience.
In this guide we have focused mainly on Google Analytics (GA4) metrics, which is a free and widely used tool. There are other analytics tools available, like Simple Analytics and matomo — both of which have their own equivalent metrics.
Average engagement time per active user
The average engagement time per active user is a metric that measures the average time a user spends actively interacting with a website or app. It’s calculated simply by dividing the total active user engagement time by the number of active users.
Unlike older versions of Google Analytics, this metric now only counts time when the content is in the foreground or active on the user’s screen, providing a more accurate picture of interaction.
What counts as a good average engagement time varies by site and industry. If you’re not yet tracking content performance, set up tracking tags to gather baseline data. You can then compare similar pages to identify which content performs best.
Events per session
Tracking the average number of interactions users perform within a single website session can be a great way of evaluating how engaging your content is for users.
It’s a key performance indicator for measuring engagement and is calculated by dividing the total number of events by the total number of sessions.
GA4 provides data on page views and scroll data by default, which can be very insightful.
However, you can take your marketing insights to the next level by defining your own custom events which are unique to your business, like form submissions, video plays and interaction with an online tool.
This will ensure a more accurate and intuitive events per session score.
Page views / Page views per session
Page views or ‘views’ as they are now named in GA4, represent the total number of times users view a page. This metric can therefore identify content which is popular amongst your audience.
Whilst no longer a metric which appears in the standard GA4 reporting, it’s still possible to establish ‘page views per session’ too.
For example, you might attract users with an informative blog post (identifying a problem), guide them to a product or service page (offering a solution), prompt them to complete an enquiry form, and finally lead them to a conversion page (generating a lead).
In this case, four page views within a single session indicate strong content performance. However, multiple page views can also mean users are struggling to find what they need. The key is to define content performance goals that align with your business objectives.
Social comments, likes and shares
A common digital marketing goal is to increase a business’s online brand presence/awareness. An effective way of achieving this is to reach a new audience by increasing your social media presence on platforms like X, Facebook, Instagram and LinkedIn.
You can measure how well your social media content resonates with users by monitoring the volume and sentiment of the comments made, alongside the number of like and shares acquired.
Analytics tools — like Buffer and Agorapulse — provide great insight into how well your social media content is performing.
Buffer excels with simplicity, content optimisation insights, and e-commerce tracking, ideal for freelance creators and small businesses. While Agorapulse offers deeper engagement analytics and a more comprehensive break down of social interactions and competitive analysis.
Bounce rate
The ‘bounce rate’ in Google Analytics 4 is defined as the percentage of website sessions that were not considered to be engaged. A session is considered to have bounced if the user viewed a single page for less than 10 seconds or didn’t engage with the content.
In contrast, an engaged session is one that lasts longer than 10 seconds, includes a key event, or two or more page views.
Bounce rate is no longer a default metric displayed in GA4, however can be calculated as the percentage of sessions that were not engaged, or added to custom reports.
There are three main reasons why monitoring bounce rate is important with regards to content performance:
- Conversion impact: Users who bounce don’t convert—reducing bounce rate can help improve overall conversion rates.
- Content and UX insight: A high bounce rate often indicates issues with content quality or user experience.
- Potential ranking factor: Some believe bounce rate may influence search rankings, though this hasn’t been confirmed by Google.
New users
A ‘new user’ in Google Analytics describes someone who interacts with your website for the first time, identified by a unique user ID or device ID, with no prior visits within a specified time frame.
Compelling, user-focussed, value add content naturally attracts new audiences, be it through strong organic ranking, being cited within an LLM, shared by a thought leader in your niche, or having been linked to within a high traffic volume publication.
Therefore, an increase in new users via these means of referral traffic can be a strong indicator of successful content.
Visibility metrics
Organic ranking and traffic
SEOs have long been creating online content with the aim of ranking in search engine results (SERPs) for target keywords within a wider topic.
Ranking well in organic search, especially Google, has long been a great yardstick for assessing how effective your content is — get onto page #1 for your parent keyword and this is a clear sign of a successful piece of content. (Backlinks and domain authority are also key measures, which we tackle below).
You can use paid tools such as Ahrefs, SEMrush or Advanced Web Rankings to effectively monitor keyword ranking performance. It’s also advised that you make sure Google’s Search Console is set-up for additional insight on the overall health of your website, identifying indexing and crawling issues etc.
Generally, the higher up the search rankings your content appears, the more organic traffic you generate to your website. And this is still true today, although the search landscape is changing.
GEO & LLMs
While at the time of writing this article Google still dominates, accounting for nearly 90% of the total search market accordingly to research from SEMrush; LLM tools like ChatGPT and Gemini are becoming increasingly popular.
As search behaviour changes, we as marketers need to adapt, monitoring how prominent our content is in LLMs and Google AI Overviews (AIO), as well as how much referral traffic they generate. Optimising content specifically for these platforms is known as Generative Engine Optimisation (or GEO).
You can measure referral traffic in GA4 from LLMs too, however most AI traffic by default is reported as either ‘referral’ or ‘unassigned’. But by creating custom channel groups or segments you can specifically analyse LLM-driven traffic.
This helps accurately assess the engagement and number of visits from users originating from AI tools and chatbots, separating the data from traditional organic search.
With LLM search expected to overtake traditional search by 2028, monitoring how your content performs in these platforms is now imperative when analysing content success.
Backlinks (domain authority)
Attracting backlinks — links from 3rd party domains — can be a great way of assessing the performance of your content. This is especially true for content like thought leading industry studies and white papers.
Generating backlinks from high quality and relevant domains helps grow a websites domain authority. The higher the authority of a website, the greater the ranking potential of the content hosted on that domain, as it’s regarded as a more credible and trustworthy source.
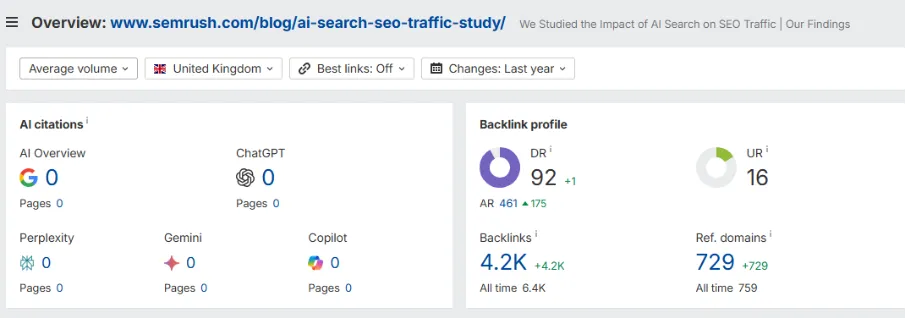
Take this study from SEMrush, for example. It’s highly likely being one of the leading SEO brands that SEMrush content goal was for the study to be read, shared, liked, sourced, and most importantly, linked to. To date, this content has generated links from 729 referring domains and therefore, can be regarded as a highly-successful piece of content.
Brand mentions
Brand mentions simply describe references to your business made on third-party websites or increasingly within AI search. Brand mentions are fast becoming a key content success metric as they indicate real-world trust and visibility.
As search engines shift towards entity-based and AI-driven ranking, mentions – whether linked or unlinked – signal authority, reputation, and relevance. They influence how Google perceives a brand within semantic search, often improving inclusion in AIO’s and featured snippets.
Beyond the SEO benefits, monitoring brand mentions can also help track sentiment, identify potential issues early, and capturing authentic customer feedback for content improvements.
Think of frequent positive brand mentions as digital word-of-mouth, strengthening your businesses credibility, enhancing engagement, and providing measurable proof of brand impact. As professional marketers in 2025, brand mentions are an increasingly important content performance metric we need to be measuring.
There are specialist analytics tools available to monitor AI mentions, such as BrandMentions and Pround. Whilst established SEO tools Ahrefs and SEMrush, offer their Brand Radar and Brand Monitoring features respectively.
Lead generation metrics
For many commercial organisations, lead generation is the single most important metric and therefore content performance is often analysed against whether it generated a lead or played a part in a conversion.
However, it can also be beneficial to measure leads within a non-commercial operation too, for example requesting an information pack from a charity website or a newsletter sign up for a local sports club.
Conversion rate
Conversion rate provides a percentage figure of website visitors who take a desired action. User actions commonly measured are online purchases or form enquiries, however, can include email opt ins or even simply engaging with a piece of content (for example a video play or PDF download).
Content designed to generate a specific user action can therefore be effectively judged on conversion rate, and in turn this insight can help shape future strategy.
If conversion rate is high, ask yourself “what makes performance so good?” and “can we utilise this insight on other areas of the website?”. Conversely, if conversion is low, ask why this is and what can we do to improve performance?
- Is the call to action (CTA) prominent enough?
- Are we displaying the necessary trust signals to reassure users?
- Can we implement funnel analysis to establish where in the process users are dropping out?
- Can we A/B test different content variants to identify the best user experience?
Measuring conversion rate, which can be done in GA4 (through ‘key events’), can unearth powerful insight into the performance of your content.
Create a content performance dashboard
Every business is different and therefore the metrics you monitor to evaluate content performance will naturally differ. Utilise this article to establish which metrics are important for your business and build a bespoke dashboard to display the key data.
The digital landscape is constantly evolving and it’s likely your dashboard will need to change over time too, but the important thing is to start monitoring content performance.
Whether you’re an in-house content writer, work as an SEO in an agency or are a freelancer, tracking the effectiveness of your content can display ROI, highlight the successes, and identify content which may need work – as always, knowledge is power.
If you require help setting up website tracking analytics, content performance dashboards or defining a wider SEO strategy, MRS have the skill set and experience to meet your unique needs. Contact MRS Digital today to establish how our in-house experts can help you.