As we know, Google likes to keep everyone in the digital industries on their toes. They certainly know how to launch (and delay) new features and platforms, switch things up to solve common problems, and try to keep things fresh.
Are they always liked? No. Do they always make sense? Sometimes. We’ll let you make up your own mind on this latest change.
Introducing – Key events
On the 27th March 2024, Google begun the roll out of a change they had discussed on several occasions before. This change certainly left us with some questions at first glance – namely, “why?”
Google explained that the change is to better differentiate Analytics “conversions” from their Google Ads (GAds) counterparts. So, Google have now started changing the name of the tracked events that matter most to your business in Google Analytics 4 (GA4), from “Conversions”, to “Key events”.
If you’ve worked closely with both GA4 and GAds, you may have noticed differences in your conversion counts between the two platforms. As GA4 and GAds measured their variant of “conversions” differently, you wouldn’t always see the same data for the same user actions, between the two platforms. This discrepancy could be confusing unless you, and other stakeholders, understood the complexities of how the two platforms measure these business-critical events.
With that, we can’t necessarily fault Google’s logic and reasoning behind this change. Differentiating business-critical measurements between the two platforms, making performance analysis, and reporting easier to understand and communicate, is welcome. It’ll just take some time to get used too.
However, the issue with this change doesn’t lie within its reasoning, but it’s implementation. Let us explain.
A gradual rollout of the implementation
Perhaps due to system limitations, testing or gauging reception (Google haven’t elaborated on this), Google is gradually rolling this change out across GA4 properties. They haven’t provided a timeline for this, only that it isn’t available across all GA4 properties just yet.

This isn’t inherently an issue, despite facing the dilemma of deciding what to call the events internally, but alongside this, and something that Google hasn’t mentioned, is that not all GA4’s features that previously relied on the term “conversion” have been seamlessly adapted to the new terminology.
Losing conversion reports
At the time of writing, after your property is switched over to support key events, you can no longer view the “Conversions” report, which used to be available under the Engagement tab within the default Life Cycle report collection.
Interestingly, Google seems to have removed this report, and not replaced it with a “Key events” equivalent. If you’re anything like us, you used this report frequently. It was the quickest way to see a count of your most important, business-critical events and useful for analysis, so we’ve found ourselves subconsciously clicking empty space in its absence.
Now we’re assuming this is a temporary oversight, and Google could add an equivalent in due course, but as they didn’t mention it to begin with, how can you view key event data in the meantime?
How can I see my Key Events data?
Whilst Google have removed the dedicated report, there are several methods to view a count of, and other relevant metrics and dimensions associated with, your key events.
Use other existing GA4 reports
One method of viewing a count of your key events is using the other reports available within GA4. As with conversions, the Acquisition, Pages and screens, and Landing page reports have key events added as a metric by default, broken down by relevant dimensions.
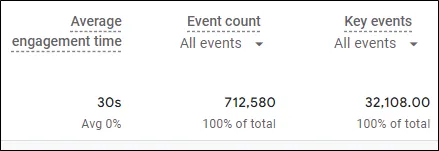
This is not an ideal solution, as these reports have specific use cases based on their dimensions, limiting breakdown and analysis potential. If you’re in need of a quick count of key events though, this is quickest and most accessible solution within GA4’s UI (User Interface).
Create a new GA4 report
Whilst you’ll need to dedicate some time, and it could become tedious if you’re managing numerous GA4 properties, you can create a new report to show your configured key events, giving you a report like the missing “Conversions” report that’s quick to access and shows you exactly what you need to know.
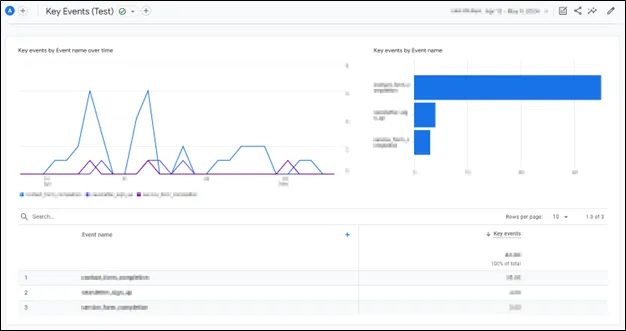
To achieve this, you’ll need to do the following:
1. Navigate to the report Library, located in the bottom-left of GA4’s reporting UI.

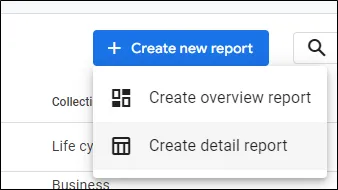
2. On the right-hand side of the library interface, click “Create new report”, then “Create detail report”.
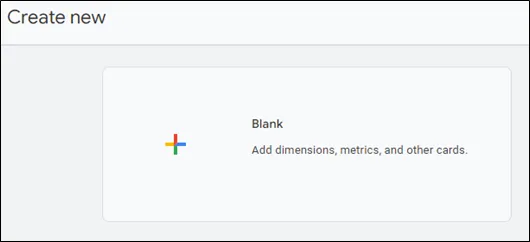
3. On the report template page, click “Blank”.
4. In the blank report canvas that follows, on the right-hand side, use the “Customize report” menu to add “Event name” under Dimensions, and “Key events” under Metrics.
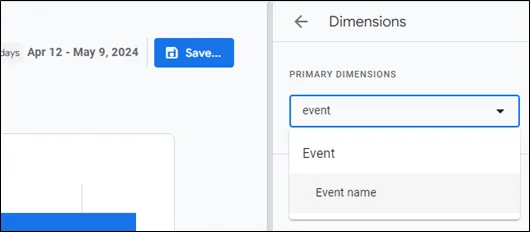
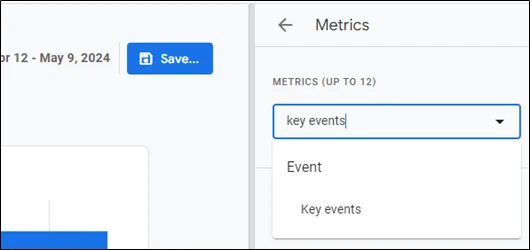
5. Now, hit “Save”. You’ll need to name your report, like “Key Events”, then click “Save”.
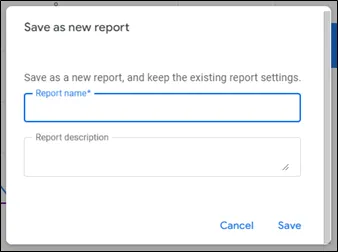
6. Now that you’ve created your report, it will be saved within the report library, but will not appear in the list of reports in GA4’s report menu. To make it visible, you’ll need to add it to the Engagement report, where the old “Conversions” report used to be. In the report Library, click “Edit collection” under the “Life cycle” report collection.
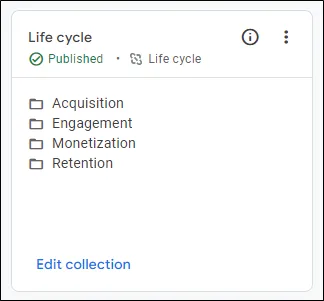
7. Now, simply drag your newly created key events report from the “Drag reports to create collection” list on the right, to the “Engagement” section of the “Life cycle” collection on the left. Whilst you can place the report in any collection you wish, we’ve chosen to place it where the “Conversions” report once was for consistency.

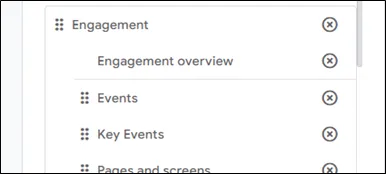
8. Click “Save, then “Save changes to current collection”.
You’ve now got an immediately accessible report that shows a count of your key events, that you can break down using secondary dimensions, filters and comparisons.
Note that adding additional metrics to the report, within the report canvas, will not show you those metrics associated with just your key events. For example, adding a “Total user” count will show you all users associated with all events, not only your key events, unless you manually add additional filters. The dimension that allows you to specify key events only, “Is key event”, is not available within GA4’s aggregated reporting.
Using “Explore”
As one of GA4’s strongest reporting features, Explore gives you the freedom to create and configure custom reports to fulfil specific purposes. In this case, we can use key event dimensions and metrics to help analyse our key event performance, such as “Is key event”, “key events” and “session key event rate”, using various report templates.
Whilst we won’t guide you through the process of creating an Exploration, as the possibilities for report creation are extensive, consider using Explore if you think you would benefit from the additional key event specific dimensions, metrics and breakdown options, a weakness of the previous method.
If you need further help with Explore or any other GA4 reporting feature, consult Google’s documentation.

Temporary solutions?
Whilst we hope these are temporary solutions, and dedicating time to this in the first place is far from ideal, you can view and analyse your key event data in a similar way to conversions using the methods above.
Need some support with GA4?
As the sudden absence of the “Conversions” report is one of many curveballs that Google, and GA4, can throw your way.
Our Insights team offers GA4 training alongside setup and auditing services to help you, and your team, demystify GA4.


