
In digital marketing, it’s commonplace to have more than one platform collecting data about your digital users and customers. Analytics solutions like Google Analytics 4, advertising platforms like Google Ads, and a CRM like HubSpot all collect data about those that interact with your business in some form, often at various stages of a customer journey.
With data pooling in differ platforms, combining, or blending, that data can assist with analysis and reveal insights about customers as they traverse from the point of becoming brand aware, to making a purchase, to becoming loyal customers. Without blending, it becomes more challenging to analyse that data and uncover the same insights, as you’ll need to work across multiple platforms at once and manually tie data entries to each other, a time consuming process that leaves more room for human error.
By blending and visualising this data in one place, you can create a centralised dashboard (report) for all customer data and communicate performance and insights to stakeholders in a unified, digestible format.
Google Looker Studio’s data blending features allow you to achieve the above but can be complex to understand and use effectively. Let’s unpack data blending in Looker Studio, when and how to use it, and consider some common pitfalls.
What is Data Blending?
Data blending in Looker Studio allows you to combine the data from multiple data sources to create blends. A blend, applied to a report component in place of a single data source, provides a component with data from two or more data sources, allowing you to visualise that data in a single component. In Looker Studio, a component is a chart or control.
Because of this, blends provide numerous advantages. Fundamentally, if you have two datasets with a field in common, which we’ll expand upon later, you can blend data from those datasets and incorporate them into one report component. This allows you to add other fields from both data sources, knowing that they have something in common, and visualise them together , assisting analysis and helping uncovering insights that would otherwise require working across multiple platforms simultaneously.
It also makes more effective use of the real estate on your report canvas and saves you time, as there’s no need for multiple components to manually compare datasets.
How data blending in Looker Studio works
Those working with databases will often use SQL join statements to combine data across tables. Looker Studio’s interface allows anyone to perform a data blend without needing proficient SQL knowledge. Plus, Looker Studio’s blend editor is far more user-friendly and editable in-platform compared to SQL, making it more suitable for on-the-fly dashboard creation.
When to Use Data Blending
If you make use of multiple platforms to collect user and customer data, you likely have a use case for data blending in Looker Studio. Blending data across platforms operated by the same company, between Google Analytics and Google Ads for example, is a common scenario, since these two platforms are intertwined and likely share matching fields.
In this instance using campaign name as a common field, you could blend ad impression, ad click and ad cost data from Google Ads, with session and content data from Google Analytics, allowing you to better understand the performance of your Google Ads campaigns within the context of your website.
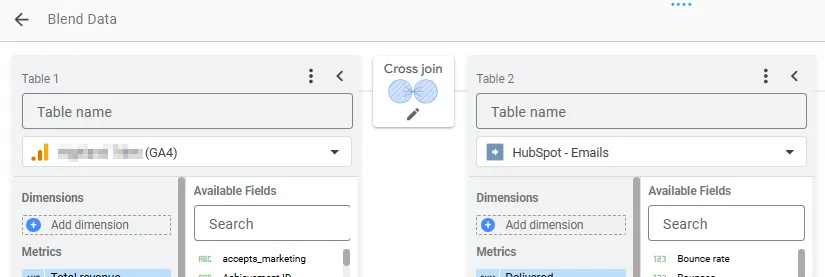
Blending data across other platforms, between say Google Analytics and HubSpot, is usually more complex task since these platforms aren’t linked and often require a third-party connector for Looker Studio. However, making use of UTM parameters, you could blend your email data from HubSpot, including emails delivered, opened and clicked, with session, key event and revenue data from GA4, showcasing the performance of your email campaigns from the point of delivery to the point of conversion on your website, and how much revenue the campaigns helped generated.
Fields and Joins in Looker Studio
In order to blend data from two sources in Looker Studio, those sources need to share a common field, or multiple fields. By specifying these fields, known as join conditions, you’re telling Looker Studio how the two sources are related.
Join Condition Field Criteria
To ensure that data can be blended across sources as intended, there are specific criteria that the fields used should follow. To perform a blend correctly, the fields associated with the join conditions should:
- share the same value data type (text, number, date).
- share the same value formatting (capitalisation, spacing).
- contain matching values. For example, Looker Studio could not match the field values London and LDN.
Join Operator
Alongside identifying how the two or more data sources are related by fields, Looker Studio allows for the configuration of a join operator. The join operator defines how Looker Studio should attempt to join matching and non-matching rows from the data sources. When altering this operator, the data that Looker Studio returns for the blend will change.
Looker Studio supports the following join operators:
- Inner Join: this operator retains only the matching rows from both data sources. This ensures that only data associated with conditions that appear in both sources is included.
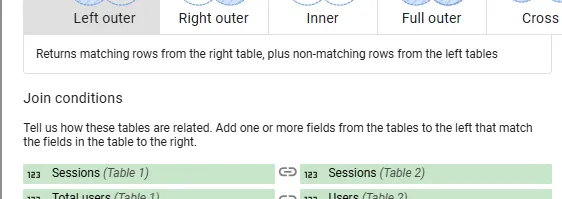
- Left Outer Join: this operator retains all rows from the left data source, and only matching rows from the right data source.
- Right Outer Join: this operator retains all rows from the right data source, and only matching rows from the left data source.
- Full Outer Join: this operator combines all rows from both data source, filling any gaps with null values. This is useful if you would like to retain all the data from both sources whilst performing a join.
- Cross Join: used less often, this operator combines every row from the left data source with every row in the right. This will combine all data, even if some rows do not have a match.
Your choice of join operator will depend on the data within each source, and which values you’d like to return. If you value one data source over another, if you would only like to see rows that match between sources, or if you’d like a complete dataset that includes both matching and non-matching rows, this will sway your choice of join operator.
Step-by-Step Guide to Data Blending in Looker Studio
Whilst Looker Studio provides a handful of different ways to achieve a blend, based on the interface you use to add your data sources and blend the data, the fundamental process remains the same.
1. Add Data Sources
First, you’ll need to add the sources that you’d like to blend. We’d advise doing this via the data source list in Looker Studio, since you can review the fields added with the data source, and it provides a better interface for handling data sources.
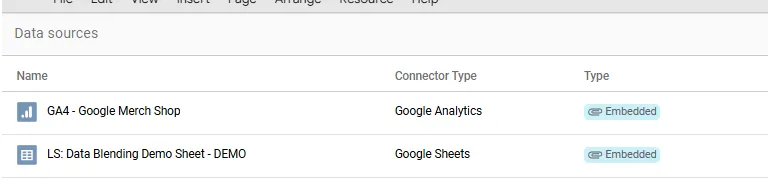
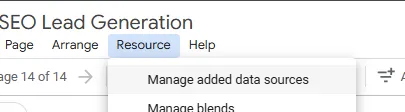
To add a data source, select Resource > Manage added data source > Add a data source. Select the connector for your data source, then locate and add your data source from the list provided.
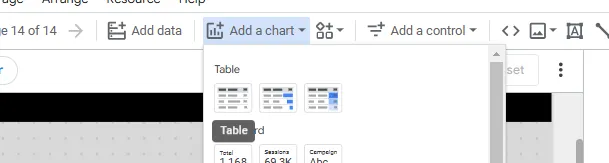
2. Add a Report Component
Now add the report component that would like to contain the blended data. A table is the most common component used when blending data, and is what we’d recommend you start with. Whilst this may not be the final visualisation you use to display you data, you can use a table to clearly see the output of blend and quickly identify any issues. You can then adjust the visualisation to suit afterwards.
3. Select Blend Data Sources, and “Blend Data”
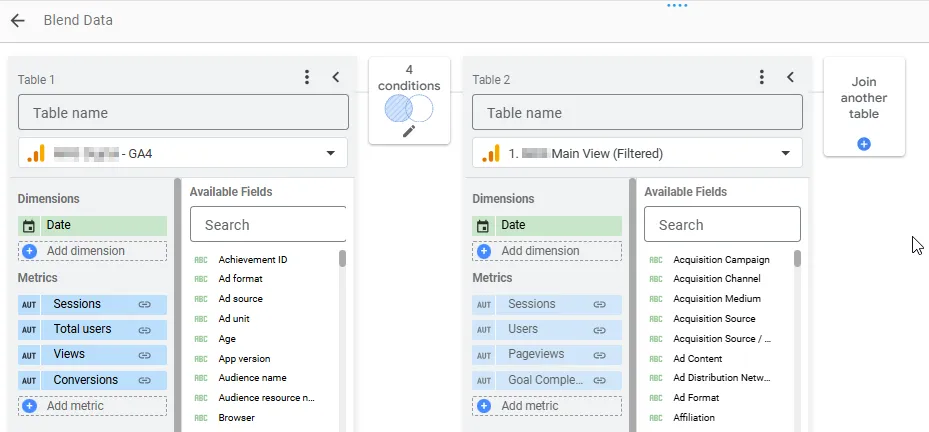
From here, ensure that the component has your left data source selected. Google interprets the currently selected data source as your left data source when blending, allowing you to then add subsequent data sources when blending.
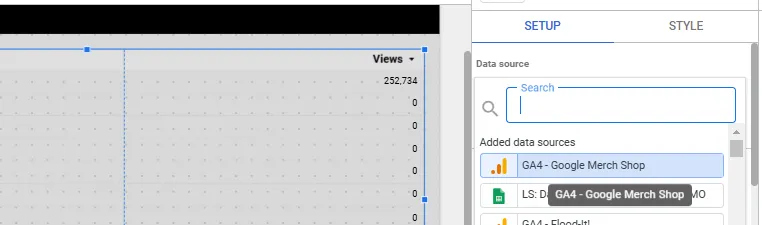
Once you’ve selected your data source, hit BLEND DATA. This will place you into Looker Studio’s blend editor. To add your right data source, select Join another table, and select your right data source.
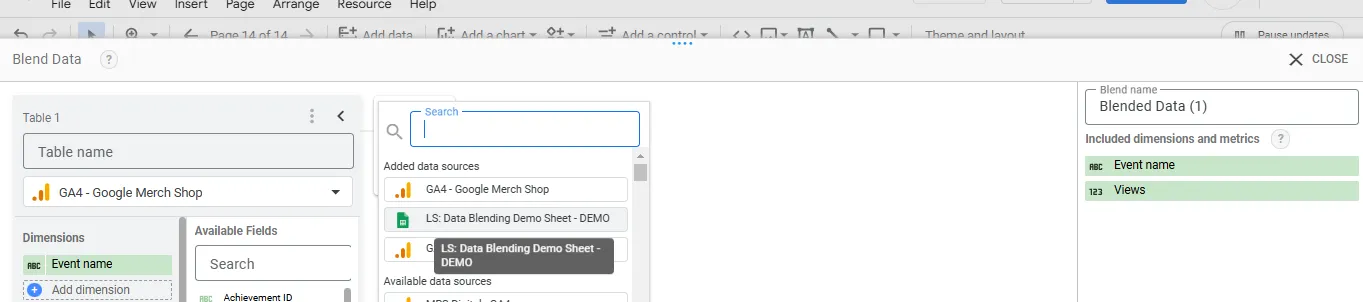
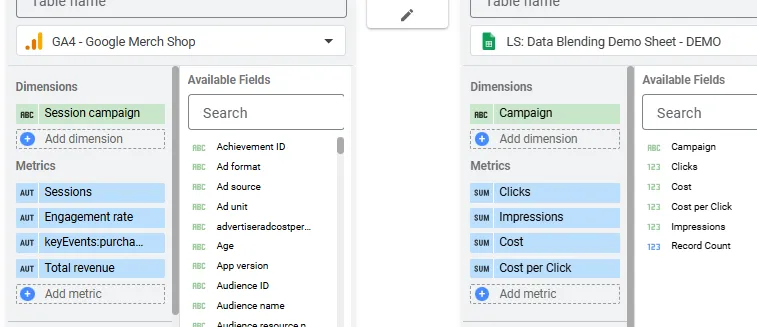
4. Select Data Source Fields
Next, select the fields that you would like to include from each data source. In our example, we’re blending website performance data from GA4, with advertising performance data stored in a Google Sheet. We’ll use the campaign name as a join condition to view all metrics from both sources in one component, by campaign.
5. Define the Join Operator and Join Conditions
To complete the blend, we need to select our join operator and tell Looker Studio how the two sources are related. In this case, we’ll use an inner join to return a list of campaigns that have a matching row in both GA4 and the Google Sheet, alongside the metrics associated with both data sources.
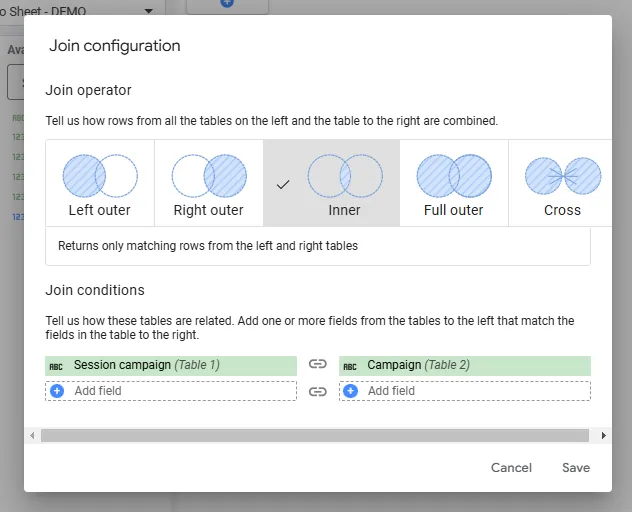
Despite having different field names, we can use GA4’s Session campaign dimension and the Campaign column in our sheet to match the campaigns by name, as the values associated with the fields match.
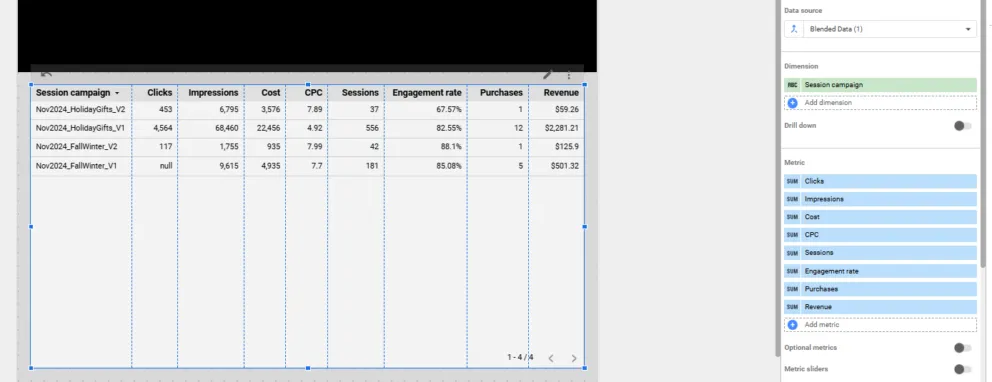
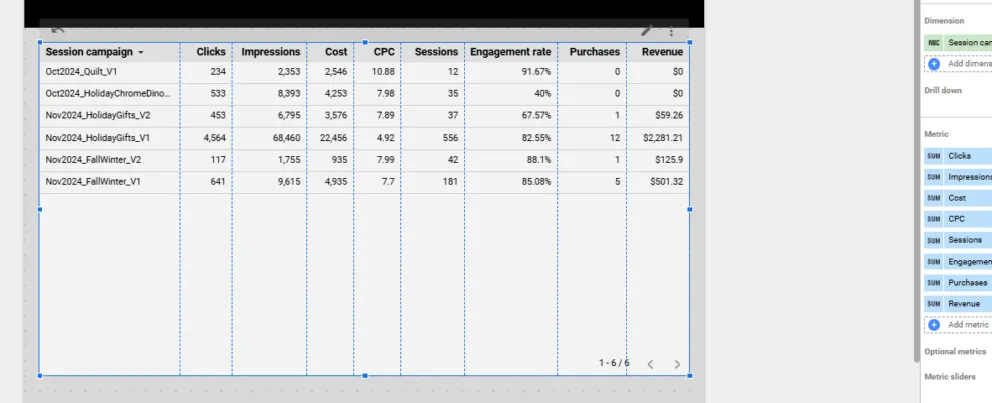
Once selected, hit Save and exit the Blend editor. With the blend configured we’ll add our join condition, the campaign name, to the table as a dimension, then all 8 metrics added to the blend. This produces a table showing both GA4s website performance data and the advertising data from Google Sheets, attributed to the campaign by name.
You can add up to five sources to a single blend, and the process for specifying the operator and join conditions remains the same for all subsequent sources. Keep in mind that you more sources you add, the more complex the blend becomes, and will require extra vigilance when checking for errors or missing rows.
6. Check Blend for Errors or Missing Rows
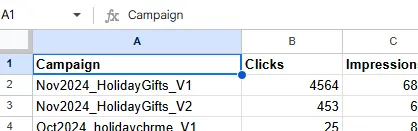
Once configured, it’s important to check the blend for errors or missing rows. In our case, two campaigns are missing from our table that are included within the list in our sheet. As we selected an inner join operator, those campaigns must lack a matching campaign in GA4, or our join condition fields don’t follow the criteria set above.
Sure enough, there are formatting errors for those two campaign values in our sheet, meaning Looker Studio can’t match them to the same campaign values in GA4. To fix, adjust the campaign name values in the sheet to match those of GA4 exactly, refresh the data source and reconnect the blend in Looker Studio, and this pulls the missing rows into our blend.
Now that we know our blend is showing the data as we intended, we can integrate the table into our dashboard to showcase our campaign performance.
Common Data Blending Pitfalls and Limitations
Data blending has immense potential, and whilst straightforward to learn, it does have pitfalls that can be challenging to resolve, especially when working with larger datasets.
First, as we rectified in our example, it’s crucial to ensure that the join condition values share the same formatting. Mismatched formatting, as minor as case sensitivity, can result in missing data from your blend. When working with larger datasets, or mismatched fields that can’t be edited directly by the user, you can use Looker Studio’s calculated fields to correct any differences in formatting.
For example, you could use the UPPER or LOWER functions to alter the casing of a field value to match that of another source, then add that calculated field as a join condition. Visit Looker Studio’s calculated field guidance and function list to assist with calculated fields.
In some instances, performance can become a limitation, with slower report and dashboard performance when working with large datasets. Similarly, there’s a limit of 5 data sources per blend, which whilst aiding performance can limit your ability to create more complex blends.
To navigate through the more common pitfalls, and those that can surface based on the data sources you use, aim to:
- pre-process the data where possible, aligning value formatting and removing any errors within the source before adding to Looker Studio.
- if necessary, use calculated fields to standardise formatting of join condition fields.
- aggregate the data before you blend, which can aid performance and reduce the chance of errors.
- aim to keep blended sources small, reducing complexity and aiding Looker Studio performance.
Frequently Asked Questions
What blending join types are available in Looker Studio?
Looker Studio includes the following join types:
- Inner Join
- Left Outer Join
- Right Outer Join
- Full Outer Join
- Cross Join
How many data sources can I blend together in Looker Studio?
You can blend up to 5 data sources together in Looker Studio. That said, aim to keep the number of blended table to a minimum to simplify the blend and aid performance.
Can I blend data with different date ranges in Looker Studio?
You can blend data that spans different date ranges, but the formatting of the date value needs to match between data sources.
Can I blend data between data sources of the same platform?
You can blend data between sources of the same platform. This can allow you to reaggregate values and perform calculation that aren’t possible within a single table.
How does Looker Studio handle metrics when blending data?
Metrics aren’t typically used as join conditions when blending in Looker Studio. Looker Studio would attempt to join the metrics based on their unaggregated values, which are likely to differ between the data sources.
When not used as a join condition, they are associated with the matching value of the join condition, like a date or campaign name, as expected.
Need help with Looker Studio dashboards?
Whilst data blending can foster greater analysis and insight, it is one of many Looker Studio features that contribute to an accurate and visually appealing dashboard.
At MRS, we offer Looker Studio dashboard services to simplify and empower your reporting.
Why not get in touch?