Google Analytics 4’s standard, aggregated reports give you a strong understanding of the metrics that matter the most to your business, giving you the freedom to plot, sort and filter different metric and dimension values to gain insight.
However, for more advanced queries that require reports with combinations of metrics, dimensions and segments not available within GA4’s standard reports, explorations is the feature to use.
GA4’s explorations, accessible via the Explore panel in GA4, is a powerful feature, yet can quickly become overwhelming if you’re unfamiliar with how to navigate the interface, how to create and customise reports, and the options available to you for sharing your reports. There are also some limitations of explorations to consider, which could confuse you or catch you out if you’re unaware of them.
Let’s break down explorations and learn how to create and share reports that can reveal valuable insights for you and your team.
How to Navigate to Explorations
Explorations are accessible via the Explore panel, on the left-hand menu of GA4’s interface.

Once in, you’ll be presented with a selection of report templates, alongside a list of any explorations created within your GA4 property prior.
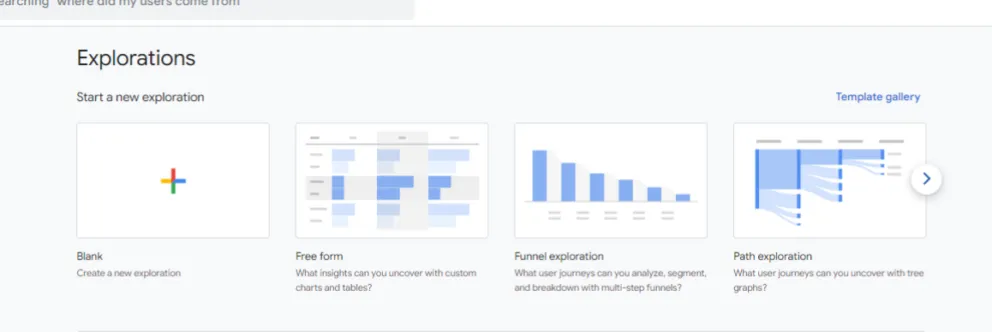
In this guide, we’ll begin with a blank Exploration to run through how to create a report from scratch, but Google’s listed templates alongside those in the template gallery are pre-populated with dimensions, metrics and in some case segments, which can save time if you already have your report use case in mind.
That said, we find you’ll often want to customize these templates to suit your needs anyway, in which case starting from scratch can be just as efficient and avoid unnecessarily cluttering your workspace.
Create and Share Reports
1. Select a new Exploration
To start from scratch, select Blank. When selected, you’ll find yourself in the explorations interface.

2. Understand the Explorations Interface
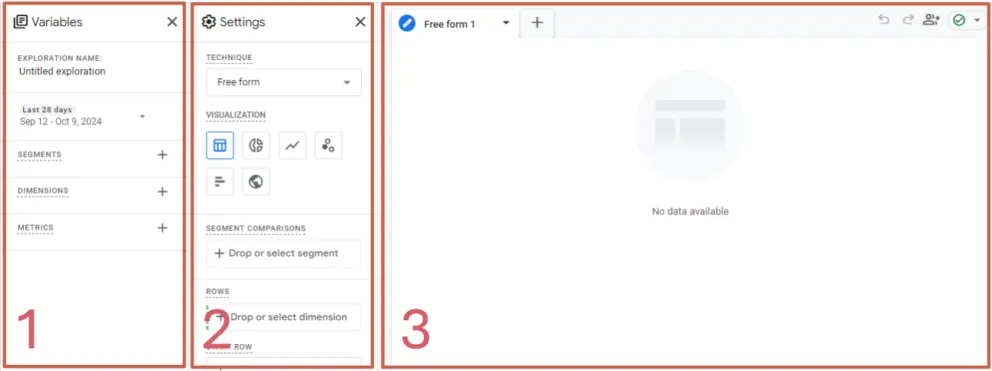
From left to right, the Variables (1) panel enables you to name your exploration, select a date range for the data shown, and add the segments, dimensions and metric fields that will make up your reports. Ensure to make the name of your exploration representative, for future reference, and set your date range as intended. Note that date ranges cannot be changed by users viewing shared reports, only the user who owns the report.
The fields added here don’t get added to your reports automatically, instead think of this panel as an inventory, where you can add a selection of fields that you might need. It’s best to keep this panel tidy, but you can use it to add various fields and experiment to see which work best. For example, you may wish to add metrics that are scoped differently and change between them to see how this affects the report you create.
The Settings panel (2) is where you configure your reports. On a fundamental level, the fields added in the Variables panel can be added, or dragged and dropped, into the selection boxes on this panel to build a report. You also have control over the technique, visualisation, row and column settings and filters here, affecting how the fields you add are displayed and how the data is shown.
Finally, the canvas (3) on the right-hand side of the interface shows your currently selected report, and changes dynamically as you alter the Settings panel. This contains a single tab by default, allowing you to configure your first report. Adding additional tab allows you to configure additional reports within the same exploration, reusing the fields available within the variable panel. You can select a different technique to your original report too, allowing for the use of multiple techniques in one exploration.
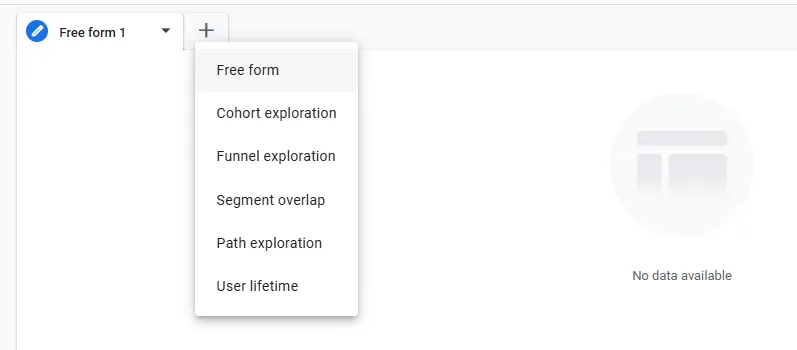
3. Choose a Technique and Visualisation
Before you begin adding fields and altering report settings, you’ll need to decide upon a technique.
Selecting a technique is the type of exploration report. The free form technique is the most flexible, allowing you to add fields at will that are displayed based on the visualisation you select.
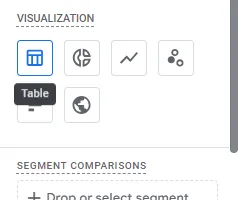
The visualisation selection, only applicable to the freeform technique, determines how your data is shown. Like the technique, altering the visualisation changes the Settings panel to suit. A table is an organized way to highlight relationships between the metrics and dimensions you select, donut charts are great for showing a part-to-whole relationship in your data, whilst line charts can show how your data changes over time. The visualisation selected will again depend on your needs and Explore gives you a host of options that suit almost any use case.
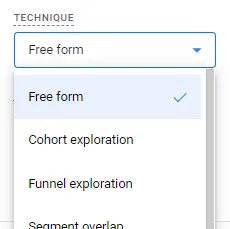
Free form doesn’t suit every use case though, and other techniques are available for more specific queries. A funnel exploration is ideal for analysing user journeys and the steps users take towards completing specific actions.
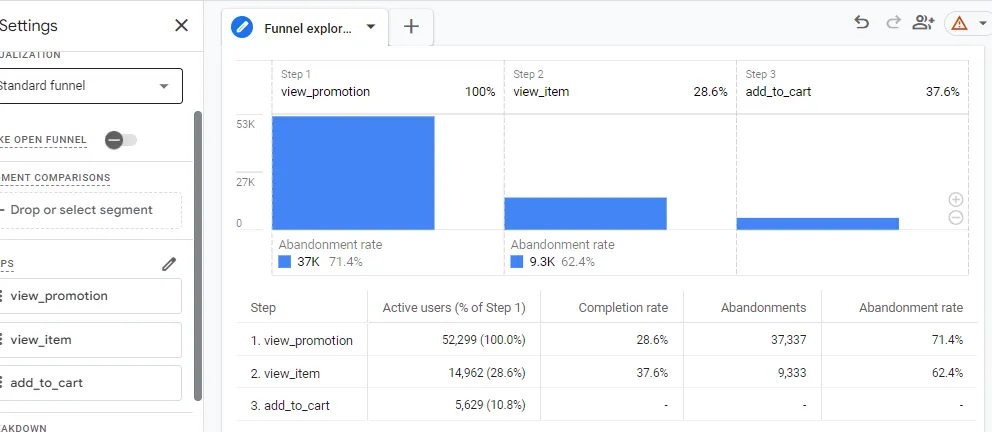
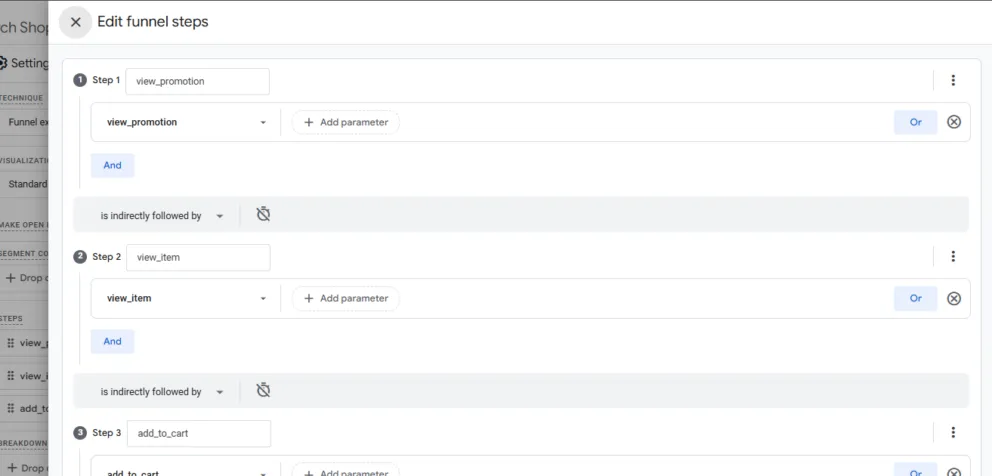
To configure a funnel exploration, select your choice of dimensions and segments much like a freeform. Within the settings panel, you’re able to adjust the steps shown within the funnel in an interface similar to that of the segment configuration and break down and segment the funnel by any dimension and segment within your Variables panel.
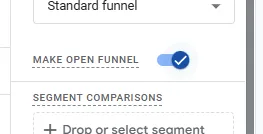
Toggling the make open funnel switch in the settings panel allows you to switch between a closed funnel and open funnel view. When disabled, the funnel chart will only display step counts for users that have completed all preceding steps. When enabled, the funnel will show new funnel entries as well as continuing funnel entries, showing the users that entered the funnel at a later step having skipped previous steps.
A path exploration is great for analysing sequences of events or pages in progress towards or following an event or page.
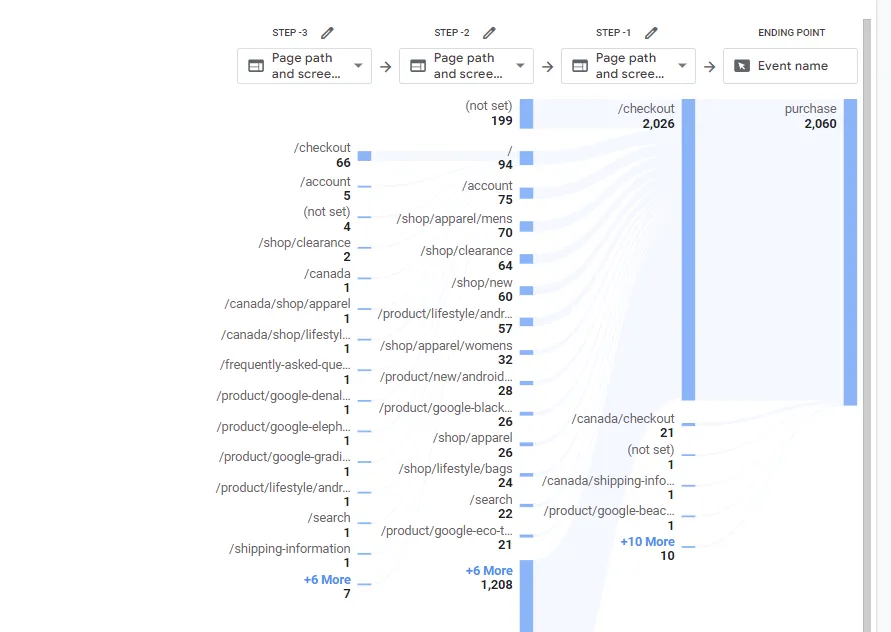
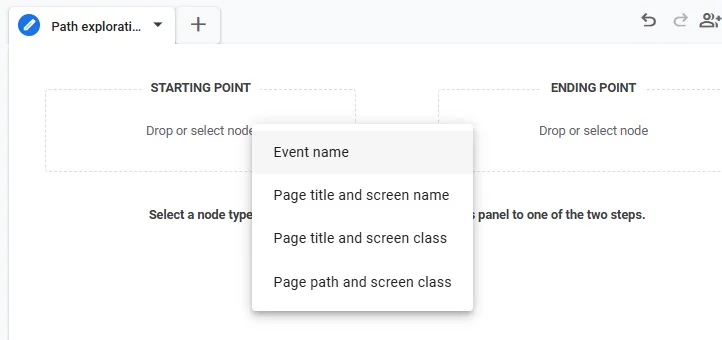
Path explorations contain nodes, the contents of each step, and are preselected. These include the event name, page title and screen name, page title and screen class, and the page path and screen class.
Pressing start over at the top of the report canvas will reset the exploration, allowing you to configure your own starting point or ending point, add nodes and specify what they contain. Much like funnel explorations, you can break the report down by dimensions and select values from your metric list, though this is limited for path explorations due to dimension and metric compatibility restrictions, discussed below.
4. Add Metrics and Dimensions
Once you’ve settled on a technique and visualisation, you’ll need to add metrics and dimensions to populate your report.
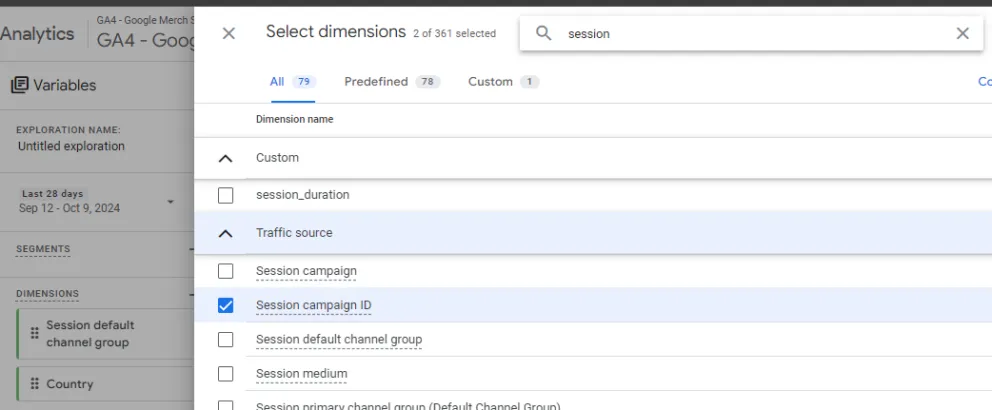
To add metrics and dimensions, select the + icons within the Variables panel. You’ll be able to select your choice of metrics and dimensions from the list shown, and be able to search for specific fields to make that process easier. Note that you can tick a selection of fields in one sitting, then hit Confirm to add them all at once.
The possibilities for metric and dimension combinations are extensive and will again vary heavily depends on your needs, but keep in mind that not all metrics and dimensions are compatible with each other. Differences in scope is the main obstacle to watch out for, though Google does grey out fields that aren’t compatible with those you’ve already added.
We’d encourage experimenting, as different combinations of fields will allow you to view your data from an entirely different perspective, though keep in mind that you need to approach explorations with an idea of what you’ll like to gain from your data. It can be easy to get overwhelmed with the volume of fields available to you, especially when you factor in differences in scope, so we’d advise understanding you and your wider team’s insight needs before diving into Exploration creation.
5. Configure Segments and Filters
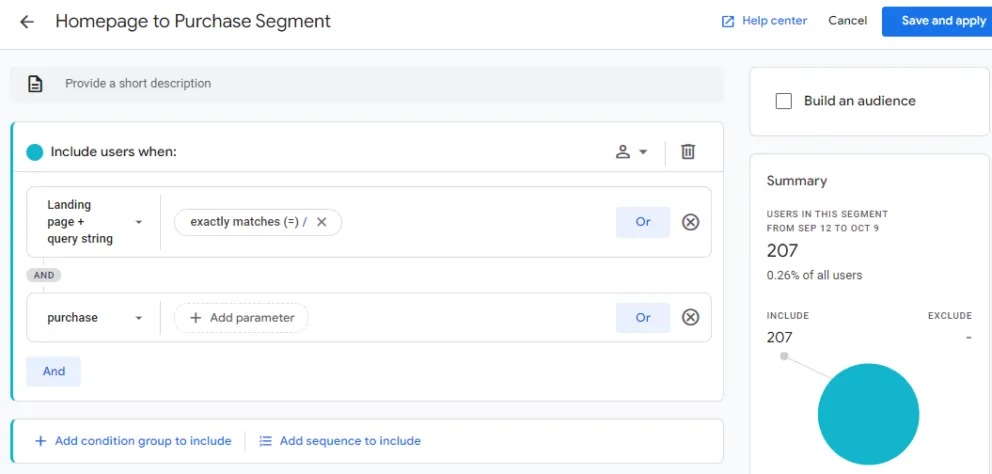
Segments, configured and added in the Variables panel, allow you to segment a portion of your users, sessions or events by specific conditions. Segments can be created and applied to entire reports, isolating the data within that report to what you specify.
Upon clicking the + icon next to Segments, you can select to use either create a custom segment, giving you complete control over the conditions and settings to include, or a reference segment. Reference segments give you various pre-configured segments to pick from, such as those more generalised and those for shopping.
Google also provides templates that steer your segment creation with pre-filled conditions, as well as predictive segments, based on users who are likely to complete specific actions in a given timeframe.
To configure a segment, enter a segment name, and select conditions under add new condition. To describe how multiple conditions are related, you can select or as well as and to add additional conditions. You can also add additional condition groups, alongside sequences, which specify the order in which conditions should be completed to qualify a user, session or event for a segment.
Filters, at the base of the Settings panel, allow for the inclusion and exclusion of data based on metric and dimension conditions. Filters can only be set for the metrics and dimensions present within the Variables panel, but those same metrics and dimensions do not have to be in use within the report. For example, you can freely select and apply a filter to include organic search only, without needing to include channel grouping in the report itself.
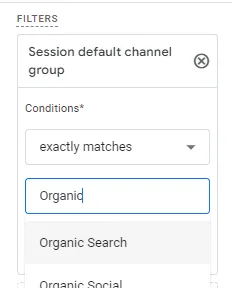
When deciding whether to use a segment or filter, segments give you a greater degree of control over the restriction of your dataset. You’re able to add multiple conditions, sequences and settings with ease, whilst filters are more simplistic in nature. You’d need to stack multiple filters together to replicate the same dataset that you could achieve with a single segment, giving segments more utility. That said, for less granular queries or to limit by a single condition, adding a filter can be easier and done on the fly from within the filters menu at any time.
6. Sharing and Exporting a Report
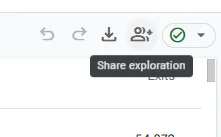
To share an Exploration with other users that have access to your GA4 property, selecting the share exploration button at the top-right of the interface will make the report visible to all users within the explorations list. There are some limitations when sharing Explorations with other property users, discussed below, though the sharing of Explorations for distribution and collaboration between users is highly valuable.
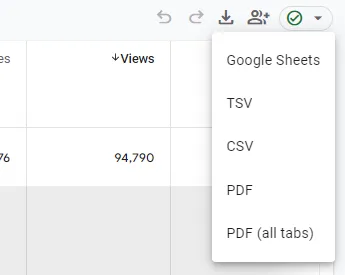
To export a report as a TSV, CSV, into Google Sheets, or as a PDF to distribute with others, select export data.
Considerations and Limitations
Despite being a powerful analysis feature, explorations do have some limitations and restrictions that you will need to consider, especially for more complex queries and if you work with larger properties that receive more traffic.
Data and Field Limitations
Google limits explorations to 200 individual explorations per user, and 500 shared explorations, per property. Dimensions, metrics and segments are also limited, 20 dimensions and 20 metrics can be added per exploration, whilst 10 segments and 10 filters can be applied at a time.
As GA4’s standard reports and explorations are designed to fulfil different purposes, the level of granularity as well as the available metrics and dimensions differ. Dimensions and metrics available in standard reports are not available in explorations, and vice-versa.
Date Ranges
Unlike GA4’s aggregated reporting, the data within explorations is limited by the data retention settings of your GA4 property. Set to a maximum of 14 months for standard GA4 properties, 50 months for 360 properties, this will determine how much data is available to you in explorations.
Sampling, Filtering and Processing Differences
Compared to GA4’s aggregated reporting, filtering works in a different manner, as do segments and comparisons, including differences in case sensitivity and the fields that are supported. User counts, behavioural modelling as well as processing times can also result in sampling or mismatched data between reports and explorations.
Sharing and Collaboration
Whilst sharing Explorations and collaborating with other property users is valuable, there are some limitations that you should consider. First, shared Explorations in GA4 are not collaborative in real-time, meaning any changes made are not shown to other users immediately, which can result in duplicate edits. GA4’s role-based permissions are also a factor, meaning some user-specific options including filters and segments will not be applied as intended. Additionally, anyone who has the Viewer role in a property will not be able to edit a shared Exploration and will need to create a copy of it in order to do so.
Need support with GA4?
GA4’s extensive reporting features are powerful but challenging to understand and make the most of.
To equip you and your team to better leverage GA4, our Insights team offers GA4 training as well as GA4 setup and configuration services.
Get in touch today.


