Before the Black Friday period, with the day itself falling on 29th November 2024, it’s likely that the focus will have been on preparation. To make the most of one of the busiest online shopping periods of the year, working hard on ecommerce strategy, website content and measurement to ensure that everything is in order will have been a top priority.
However, assuming that your measurement was configured and checked for scope and integrity beforehand, now that the period is over, you’ll be left with a mountain of data in platforms like Google Analytics 4, Google Search Console, and Google Ads, that can provide rich insights into how you website, users and customers performed and behaved.
These insights can help you shape strategy, optimise your website, product offerings, ad assets, and be better prepared for future promotional periods.
Let’s unpack how to analyse website and content performance, analyse product performance, uncover behavioural insights, and learn more about your customers using your Black Friday data.
Analyse website acquisition
To begin, take a closer look at the data gathered from your website. This data is invaluable, as it can tell you how effective your website was at steering prospective customers towards making those all-important purchases.
A great place to start is understanding your website’s user acquisition, using reports like GA4’s acquisition reports, within the life cycle report collection. These reports, particularly the traffic acquisition report, can quickly reveal your traffic volumes during the Black Friday period, and allow you to compare against your typical traffic volumes.
You can supplement this with Google Search console, providing page and query data that can help you identify top-performing pages and search queries in Google’s search results, alongside click-through rate trends and any issues like site coverage problems.
This can provide the first, top-level insights into how your website performed during the period, helping you determine whether your website’s traffic volumes met targets and expectations. Benchmarking performance against the same period last year or business-as-usual can be a great point to start. Additionally, top-level engagement, event (including purchase and conversion rates) and revenue metrics are available here, which you can also compare against targets and past performance.

You’ll also see those same metrics broken down by channel, showcasing which channels your website users arrived via, whether that be organic search, paid search, email, or another channel. This can reveal which channels were responsible for driving the most traffic to your website, but also how effective those channels were at converting customers, helping you decide which channels to prioritize and invest in next time around.

Analyse content performance
Next, consider analysing your website content over the Black Friday period. GA4’s landing page report is especially valuable, revealing the performance of pages that your users landed upon when arriving at your website. Being the first piece of content that a user sees on your website, understanding how well each page performed, including traffic volumes, purchase volumes and how much revenue is attributed to each is critical. Relating this back to acquisition analysis, you’ll also be able to see how well the pages associated to any advertising activity performed.
Supplementing this with Google Search Console data can reveal the queries that brought users to these pages too, like any generic Black Friday-related terms, helping you analyse the relevance of your content and optimize accordingly for future campaigns.
Using this data, you may learn that certain high-performing landing pages have high-performing elements that help drive purchases, which you could leverage on other pages, or identify that some landing pages have a higher engagement rate than others, helping reveal usability or content relevance issues. Content grouping in GA4, if configured, can assist here, grouping pages into defined categories.
Similarly, analysing events triggered on each page, such as scroll events, can help you determine how users were engaging with the content on each page. Scroll depth events, triggered by a 90% depth threshold by default in GA4, could reveal whether users are scrolling far enough to reach calls to action, or whether they’re intaking page content in full.
Note: GA4 gives you the freedom to customize any default, aggregated report to suit your needs. Consider adding any valuable metrics that aren’t present by default to any of the reports mentioned, giving you greater analysis potential.
Analyse product performance
Naturally, for an ecommerce website your product performance is a key area to analyse when utilising the data gathered from Black Friday. You can make use of GA4’s monetization reports to identify your top-performing products, product categories and product variants by revenue, quantity purchased, and average purchase value. We’d recommend beginning in the ecommerce purchases report.

This can not only help you manage and forecast inventory for future events, but uncover how successful advertising geared towards certain products was for you. If you notice that purchases and revenue for a product or product category that you actively pushed customers towards have spiked, you could trace that back to your acquisition efforts with the help of acquisition and landing page reporting, and Google Ads. This can help you better understand the effectiveness of your advertising campaigns, including your audience targeting, ad copy, campaign type usage and bid strategies.
Analysing products by ecommerce event counts, including items viewed and items added to cart, can reveal which product are more likely to be purchased following a user interacting with them, and whether user journeys differ depending on the product being purchased.
For example, some comparable products may have a higher view-to-purchase rate than others, which could suggest that something about those products, or the product pages and content, are more effective at converting users. A greater number of positive reviews, stronger discounts or product attributes like colour could be factors to consider. You could use these insights to optimise other product pages, if you notice that better-performing product pages differ from others.
Uncover behavioural insights
In addition to website and product performance insights, the data gathered during Black Friday can shed additional light on the behaviours of your website users and customers.
Understanding the actions that users take on your website, in what order, and whether users are becoming stuck or disengaging from your website before or after certain actions can reveal whether users are following the desired user journey. Once you understand the journeys that users are taking on your site, you can work towards improving conversion rates by removing anything that could be blocking those users from converting.
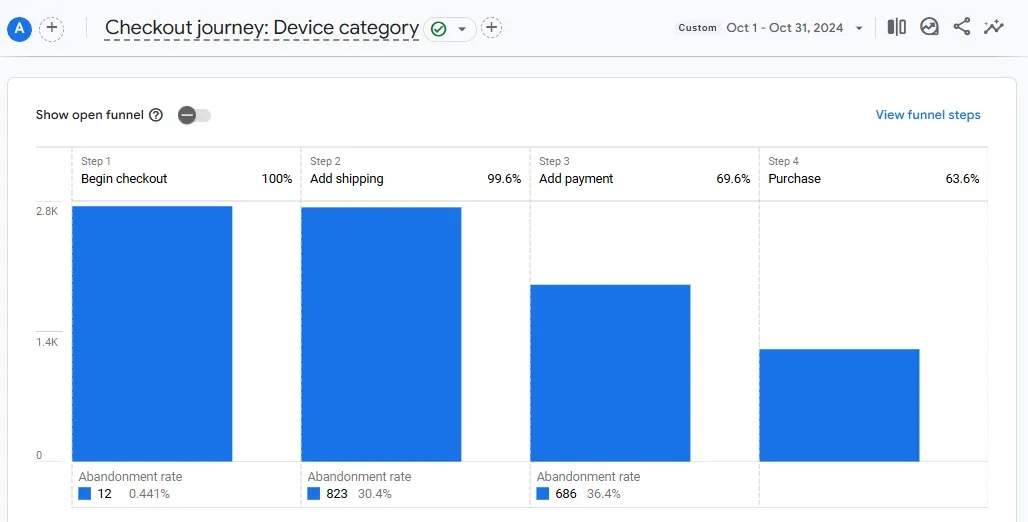
GA4’s purchase and checkout journey funnel reports, also under the monetization report collection, can reveal the ecommerce events that your users trigger on the way to making a purchase, and the user abandonment rate between those events.


Examining the abandonment rates, as well as altering the report dimension, you can better understand the points at which users are exiting the desired user journey, and work towards identifying any causes.
For example, you may notice that a significant portion of users exit the checkout process after adding shipping information, at the point shipping costs are revealed to the user. Following that, you uncover that your shipping costs are higher than your competitors, and make up a higher-than-expected percentage of your customers total order value.
On the shipping page there’s also a link that explains shipping costs in more detail, which whilst helpful, brings users out of the checkout process and requires them to restart. As such, users are abandoning their carts and not returning.
Although you could have identified this user pain point without the data from Black Friday, the additional site traffic gained during the period has emphasized the issue, making it more pronounced in your reports and allowing you to successful identify it.
A lack of stock at the point of checkout, poor optimisation on different devices, and limited payment options are other common issues to look out for, amongst others.
Alongside blockers that inhibit users converting, you may notice trends in how your users behave around or during the event, too. If users are made aware of a Black Friday sale before it begins, they could wait before making a purchase to ensure they take advantage of the lower pricing, which could result in a dip in site metrics, performance and revenue before the event. If this is something you encounter, you could alter how and when you communicate your Black Friday event to users, reducing the chance of users deciding to wait for the sale to begin. Google Trends can help here, allowing you to understand when interest in Black Friday starts to build amongst web users.
Learn more about your customers
With it likely that more customers are traversing your website than normal, Black Friday also gives you ample opportunity to learn more about your customers.
Rather than utilising the analysis methods above across your whole customer base, segmenting your customers by demographic, whether that be by age, location, device, or content viewed, can uncover rich insights into how different portions of your customer base act and what they prefer.
You’re likely to notice that different demographics approach their purchases differently, navigate your website in a different manner or tend to favour different acquisition channels, amongst other variations in behaviour. This is invaluable if you plan to refine who to target for advertising, and want to ensure that the right customers are steered towards the products that suit them.
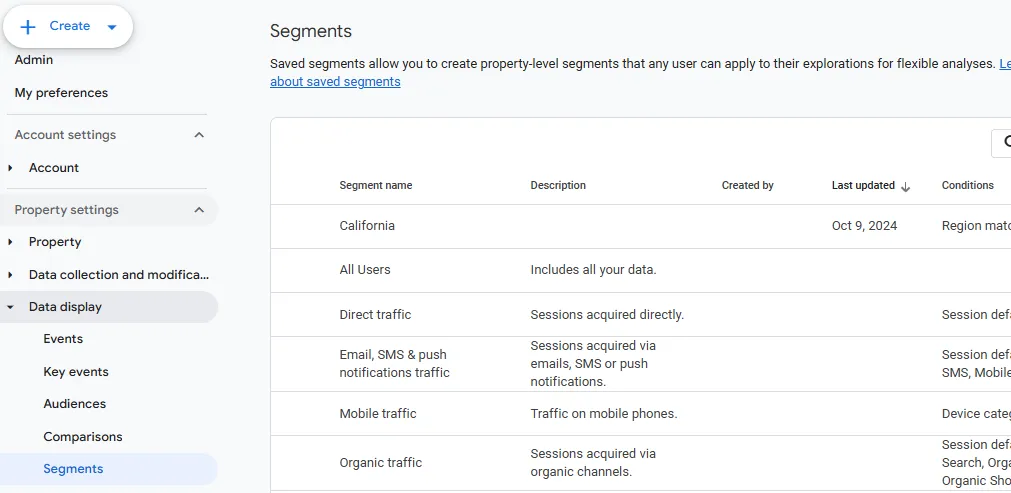
Segments created in GA4, via the data display menu under admin, can be applied property-wide by any user, across both Explorations and GA4’s aggregated reports. In aggregated reports, these are referred to as comparisons.

Aside from demographic segmentation, analysis of new against returning users can reveal further insight. Comparing metrics for new and returning users can help you determine customer loyalty and acquisition effectiveness, and how well you’re able to re-engage users who might have bounced or abandoned during an earlier session.
You can also better understand whether your advertising efforts are stronger at attracting new customers, or re-engaging those with a history of engagement with your website or brand already.
Alongside segments, Audiences allow you to group those same users for use in targeted advertising and remarketing, valuable for future Black Fridays and other sale periods, particularly in the run up to the festive period. You may find that your audiences and segments differ for Black Friday compared to other sale period though, so consider this when utilising them for other events.
Need help understanding your data?
Platforms like GA4, Google Search Console and Google Ads can be highly valuable for ecommerce websites, giving you the insights you need to review peak periods, and prepare for the next one. However, I can be challenging to understand and fully-leverage all that those platforms have to offer.
We offer GA4 training to empower you and your team, alongside ecommerce SEO and Google Shopping expertise to help you boost your online sales.
Get in touch today.


