In October 2020, Microsoft launched a new, free analytics tool for webmasters to utilise on their website. Like other analytics platforms, the aim of this tool is to understand your users better and gain insight into how they are using your website.
Our take on this tool is that it complements other analytics tools such as Google Analytics, however, it is limiting as a standalone analytics tool. In this article, we discuss our take on Microsoft Clarity with particular focus on how the reports can be used to aid your online business.
Microsoft Clarity vs. Google Analytics
We recommend using these two products in harmony instead of one over the other. Google Analytics provides a fully in-depth data collection which is then processed into data metrics which you can utilise outside of the interface.
Microsoft Clarity works differently; it is designed to provide insight into users’ engagement. It enables websites to gain visibility on potential blockers by tracking and reporting on specific interactions that highlight user frustrations:
- Dead Clicks
- Rage Clicks
- Excessive Scrolling
- Quick Back
Microsoft Clarity provides a more qualitative approach to user analytics compared to Google Analytics with the use of session recordings and heatmapping reports.
Reports and Features
Within the Microsoft Clarity interface, you are presented with four tabs at the top of the screen:
- Dashboard
- Recordings
- Heatmapping
- Settings
Dashboard
Similarly to the Home report in Google Analytics, Microsoft Clarity provides a variety of widgets to showcase your website’s data.
On the top line you have top-level, aggregated user stats which correlate with similar metrics of Google Analytics. Microsoft distinguish between users and sessions for traffic data.
Traffic & Engagement Metrics
As well as traffic, engagement is a focus for the top-level stats in Microsoft Clarity. Each website has the average pages per session, scroll depth and active time on site calculated for the time frame of data selected.
Semantic Metrics
The next layer of data, the dashboard provides metrics that indicate negative interactions or frustration by the website user. Large percentages against these metrics are likely to result in a poor user experience. These are:
- Dead Clicks – When a user clicks on an element on the page, and nothing happens. It usually indicates the user is expecting to be able to interact with that element to perform an action.
- Rage Clicks – Aptly named, this action is when the user frantically clicks within a small area of the site. It often highlights frustration of the user hence the name.
- Excessive Scrolling – This occurs when a user scrolls through a page more than expected. It typically tells us that the user is not interacting with the content on the page instead they are scrolling up and down the page in opposite directions. This indicates issues with usability, irrelevant content or counterintuitive site interactions.
- Quick Backs – This is when a user lands on a page and quickly reverts back to the previous page, whether on the same website or a previous website with quick succession. Microsoft uses the dwell time for the page to determine if the interaction should be countered as a quick back or not.
If any of these semantic metrics have large percentages associated with them, it is likely that they are contributing to abandonments. Microsoft Clarity provides the ability for webmasters to investigate this further by linking session recordings to the metric. This enables you to watch back recordings of sessions where these negative user interactions occurred.
What you can learn
These metrics can help you uncover blockers in your user experience that is likely to result in abandonments.
Website Interaction
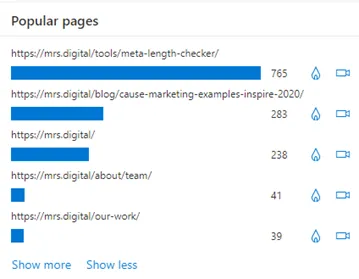
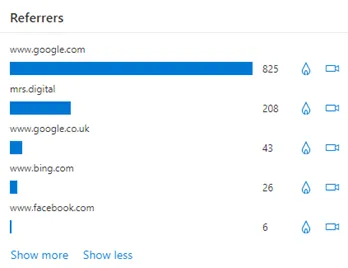
Similarly to Google Analytics and other analytics platforms, Microsoft Clarity provides data into the top referrers and popular pages. Although not stipulated on the referrer or popular pages, we assume the metric for these reports refer to sessions as per the other metrics displayed within the dashboard.
Within the referrers widget we are exposed to the first limitation of Microsoft Clarity, the ability to control the data interpretation. Within the MRS Digital referrer list, we can see a self-referral occurs as our second top referrer. In Google Analytics, you can configure your data to exclude self-referrals however currently there does not appear to be a way to do this.
Ironically there is no clarity on how each metric is calculated, with our knowledge of other analytics platforms, we can make an educated guess however the current documentation to support Microsoft Clarity does not reference how each metric is calculated.
Popular pages are likely to refer to most viewed pages (the equivalent of the pages report in Google Analytics). If comparing to Google Analytics, the volume of metrics of available in Microsoft Clarity it is lacking somewhat. However, using the heatmapping data alongside sessions recording enable you to understand more what aspect of you content users are interested in, and if they are expecting to be able to do something the functionality is not available to do.

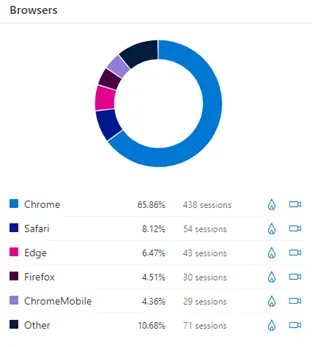
Audience Insights
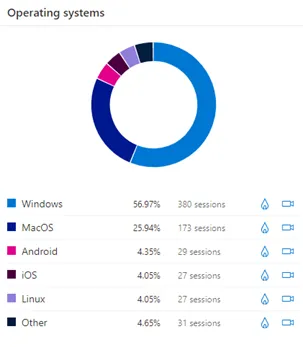
Microsoft Clarity provide a small amount of audience insight based on the technology they use and geo location. This splits your data into the top devices, operating systems, browsers during you specified time frame and calculates the percentage share for each. For each technology type, the webmaster can drill down to view sessions recordings and heatmaps giving the option to step in the shoes of the user and experience their same experience with the website.
What you can learn
These widgets bridge the gap between quantitative and qualitative data seeing the most popular ways to access your website with the additional option of watching the recorded interactions from those devices, operating systems and browsers. This enables you see if the UX elements are impacting a particular device, browser and operating systems.
An ideal use case will be viewing examples of users viewing and interacting with your websites from a new browser or operating system. However, a limitation of version details can hinder the amount of insight you can gain here.
For each technology type, within Microsoft Clarity you can use them as a filter to understand the semantic metrics associated with a device, operating system or browser. Helping you answer questions such as “do mobile users experience more dead clicks than PC (desktop) users?” or “is someone accessing the website on Safari more likely to result in a quick back than Chrome?”
Errors
Within the dashboard, Microsoft Clarity provides the count of sessions and pageviews with JavaScript errors as well as the percentage of total sessions this impacts.
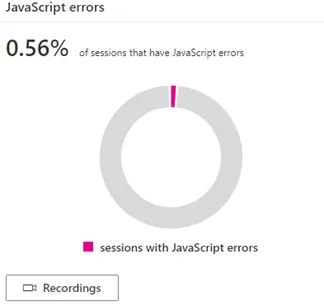
Like the semantic metrics, these can be a cause for users to abandon a website. By being able to view the recordings of when the user is experiencing the JavaScript error will help your developers to diagnose the issue.
Session Recordings
Like many heatmapping softwares, Microsoft Clarity has the ability to record user sessions to be played back. This enables you to diagnose issues experienced by users on certain pages when accessed by particular devices, operation systems or browsers.
Due to the volumes of the sessions recorded, it can be challenging to navigate the recordings unless you use the filters to refine the recording based on the information you need to find. We recommend using the dashboard tab in the interface to drilldown into the data and find the answers to your questions.
Timeline
Once you have selected a session to watch back, you can change the view timeline of that session to provide timings of interactions with the page
Heatmapping Reports
In Microsoft Clarity, the heatmapping reports are accessed by searching for a specific URL. Wildcards can be used to select URLs. Within this report you see the most clicked elements (displayed as the CSS Selector). Clicking on the web elements listed in the left-hand navigation will provide details of click volumes.
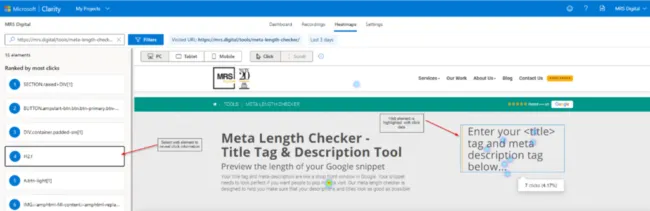
The heatmapping report can be broken down by PC, tablet or mobile to help you understand how users interact with your website on different devices. Currently this report measures clicks only, however, the design indicates that the functionality is going to expand soon with a placeholder for scroll-depth present on the heatmapping pages.
If you are using Microsoft Clarity as your sole heatmapping software, you may find gaps in functionality compared to the likes of HotJar, Lucky Orange, Crazy Egg or Mouseflow. However, this tool should not be used as a standalone heatmapping tool, instead it should give you the first step towards understanding blockers and restrictions by highlighting most clicked elements on the page. This along with the dashboard and the sessions recording can provide you with actionable insights into how to improve your user experience.
What’s Good
- No sampling – Unlike other free software, Microsoft Clarity does not restrict you from viewing your full data set. No sampling is applied.
- GDPR and CCPA compliant. Fully anonymised data – Privacy is an important factor to user accessing your website, Microsoft Clarity adheres to the GDPR as a data controller and processes data in compliance with the California Consumer Privacy Act (CCPA)
- Completely free – Microsoft Clarity has made all of its features and functionality available for free. Nothing is gated behind a paid for subscription or account.
- Site Performance – Clarity is designed not to overload your site causing no perceivable impact to your site from a user’s perspective.
- Google Analytics Integration – Websites can link Microsoft Clarity with Google Analytics to provide you with the next stage of analysis with session recordings. Microsoft Clarity creates a custom dimension labelled “Clarity Playback URL” (Universal Analytics only). Using custom reports, web analysts and digital marketers can produce an explorer report to analyse the data from a quantitative perspective and then click through to relevant session recordings to gain a more qualitative approach. Use our landing page engagement report with session recordings custom report template. Simply follow the link and attach it to your desired Google Analytics view.
Limitations
- It is not clear how much control webmasters have over their data collection.
In our initial set-up we found self-referrals show within our referral widget. However, from a technical analysis, teaming this data up with session recording will enable the developer team to replicate and debug scenarios where self-referrals occur.
- Unable to compare metrics
For many looking at their web data, being able to compare metrics over time enable’s websites to internally benchmark. What we mean by this is websites can assess what is good for them. Without the ability of a data comparison, web analysts and digital marketers are unable to gain this internal benchmark required to assess change over time which is crucial when analysing performance. - Only 12 months’ worth of data
This ties into my previous point nicely, when analysing data to eliminate seasonal data it is common to compare year-on-year (YoY) data. However, as well as not being able to compare date ranges in Microsoft Clarity, currently you can only review the last 12 months of data. This tells us you should not be expecting to use this software like Google Analytics but more like Google Search Console. - Limited Metrics
If you are comparing this analytics tool to the likes of Google Analytics, Microsoft Clarity has significantly fewer metrics it collects. This to us highlights it is not a data analysis tool in the same way Google Analytics is, instead Microsoft Clarity has found it’s niche by blending three data analysis tools to establish website performance and highlight blockers. - Unable to delete data from a specific use
Privacy is at the forefront many website masters and marketers’ minds with cookie consent forms and user’s right to be forgotten. However, if a user requests to have data attributed to them to be deleted, with Microsoft Clarity, this would mean having to delete your entire project as there is not the functionality to delete data relating to an individual. If you rely on this data as part of your performance analysis, this can be devastating.
Documentation
- Microsoft Clarity’s documentation hub can be found here: https://docs.microsoft.com/en-gb/clarity/
- Microsoft Clarity FAQs: https://docs.microsoft.com/en-gb/clarity/faq
Conclusion
Already in the digital space we are finding Microsoft Clarity heavily compared to Google Analytics and to HotJar who are dominant players in both the analytics and heatmapping software and Microsoft Clarity cannot compare to these. However, we believe it is not trying to. Microsoft Clarity adds value to web analysts and digital markers in a different way it almost sits between Google Analytics, HotJar and Google Search Console to help fill the gap when diagnosing issues and blocker prevent your users from converting. So, whilst Microsoft Clarity describes itself as a “free analytics tool”, we are seeing it as so much more than that. It is a UX tool, a heatmapping tool as well as a Google analytics enhancer that uses Machine Learning and doesn’t limit you with sampling.
It is clear Microsoft Clarity have not finished developing this software with signs of new functionality added to the current designs. With this, we hope other limitations such as the ability to compare and filter using regular expression is added too. But we will say, we will be adding Microsoft Clarity to our arsenal of digital marketing tools to help diagnose and improve performance for our clients.
If you need help powering your business through data and analytics, including analytics set up, and expert-led analytics audits, get in touch with MRS Digital today to discover how our experts can help.