
Following the deprecation of data within Google’s Universal Analytics (UA) on 1st July 2023, Google has announced that exactly one year on, on 1st July 2024, all Google Analytics users will lose access to their historic UA data.
“Starting the week of July 1, 2024: You won’t be able to access any Universal Analytics properties or the API (not even with read-only access), and all data will be deleted. While the standard sunset took weeks to complete, the full Universal Analytics shutdown will happen within a week. We know your data is important to you, and we recommend that you export your previously processed data before this date.”
Alongside a detailed timeline within their documentation, you may have seen Google’s ominous-looking countdown clock appearing when you access your UA property, warning you to download your UA data before you lose property access.
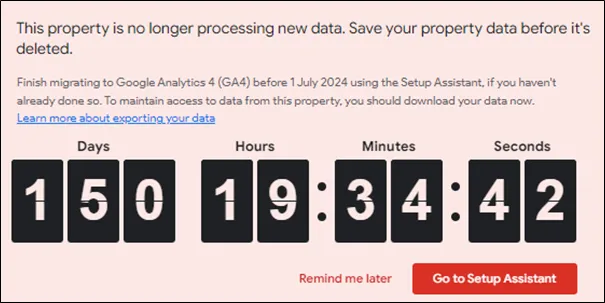
Whilst paid Google Analytics 360 users were provided with a year-long extension to their UA data processing, concluding on 1st July 2024, the removal of UA properties, historic UA data and the UA API will affect all users, free or otherwise.
Why is your historic Universal Analytics data important?
With the past decade bringing turbulence and change to businesses of all sizes, losing access to valuable UA data will make the process of historic trend analysis, past performance analysis and learning from past decisions far more challenging. UA gives you data to benchmark future performance against, and it allows you to review performance year-on-year. If you have not set-up your new analytics platform yet or you have not had it tracking accurately for very long, you may still be relying on your UA data, so it’s loss could be a major setback for you.
As Universal Analytics released in October 2012, marketing teams, ecommerce store owners and website managers, to name a few, could lose over a decade of aggregated data, spanning a period within which all businesses altered operations and made significant strategic decisions.
How do you extract UA data?
That said, it’s not all doom and gloom. There are multiple ways to extract data from UA before it’s gone forever. Although, it can be challenging to decide which way.
Within UA’s Interface
One simple, but limited option is to export data directly from the UA interface. This method allows you export single reports in a variety of formats to suit different platforms, including Excel and Google Sheets. It’s simple, but the key limitation here is you can only export one report at a time. Unless you have a lot of time on your hands and can come up with a way to keep a potentially huge list of report documents in order without forgetting which reports contain what data, you are likely better off using one of the other methods that follow.
With a Google Analytics 360 Account
With a paid, Google Analytics 360 account, it is possible to quickly extract all the clickstream data from a UA property, using Google’s BigQuery data warehouse. Alongside the extension to data processing, those with an Analytics 360 account also get what is the most efficient method of extracting large quantities of data from UA. Those benefits come at a hefty monthly price though, so unless you have the luxury of an Analytics 360 account, you will need to use a different method.
With the UA API
This method is the one we would recommend for those without an Analytics 360 account, and the method we will explore in more detail.
Using Google Sheets, an Extension for Google Sheets, and the UA API, it’s possible to extract the valuable metrics, dimensions, segments, and filters from an existing UA property to build reports within Sheets, showing historic trends, performance, and behaviours.
By carefully selecting what UA data to extract, these reports can complement the reports available within newer analytics solutions, like Google Analytics 4 (GA4), providing a much longer timeframe to compare newly collected data against. Additionally, that same UA data can be imported into reporting platforms like Google’s Looker Studio, enabling enhanced visualisation, historic referencing, and further comparison.
Whilst some of UA’s metrics are named or calculated differently to their GA4 equivalents, something explained within Google’s documentation, the ability to compare and blend data from multiple platforms is still highly valuable.
To achieve this, let’s guide you through the process.
1. Data selection
First, you will need to decide what UA data is important to you and your business. Consider what data will be most valuable when decision-making, and how you would like to analyse and visualise that data.
If you are already using a new analytics platform like GA4, consider evaluating which aggregated reports you find most valuable within that platform, and note the metrics and dimensions used within those reports. Using the documentation linked above, you can find the equivalent metrics within UA, and create a selection of reports that are comparable to those within your new platform.
Evaluating your data and reporting needs can be a complex, time-consuming task. If you would like some support, get in touch.
Any combination of existing UA metrics, dimensions, segments, and filters can be extracted using the UA API to create meaningful reports, regardless of website objectives. To ensure that the reports you create are meaningful, you will need to plan what data they’ll contain, designing them in a way that allows you to reference them in future. Below, we have compiled a list of reports and accompanying attributes that are likely to be valuable depending on your business needs and website objectives.

Lead generation
Overall website performance
For generalised website performance reporting on lead generation sites, consider using high-level website metrics, including views, users, sessions, session durations and conversions broken down by month. This will provide an informative snapshot of overall website performance, which can be compared over time and used as a benchmark for future performance goals.
Acquisition reporting
User acquisition reports are essential for understanding where your site users came from, and which channels they used to arrive at your website. Consider using relevant acquisition dimensions, including channel, source, medium and campaign, alongside high-level and engagement metrics, broken down by month. This will provide a comprehensive overview of website user acquisition, essential for benchmarking against future performance and evaluating the return on acquisition strategies.
Conversion reporting
Goals, or conversions, are the actions taken by users that are most valuable to your business, such as successfully generated leads. It is likely that you’ll want to compare and evaluate these business-critical actions, so consider reporting on each configured UA goal alongside goal performance metrics, including a goal count, user counts and conversion rates. This data could be broken down over time, by website content or by acquisition channel.
Content reporting
To understand which website content performed well, generating the most leads, or engaging the most users, consider using landing page and page dimensions, alongside key page performance metrics, broken down by month. Report viewers will be able to compare performance and return between different content strategies, something particularly useful for evaluating SEO and written content efforts.
Custom measurement
Consider extracting any custom UA dimensions or metrics that were configured to measure actions specific to your website, as you may not be able to use UAs pre-defined metrics and dimensions to gain the level of insight required to understand these actions. Similarly, you may want to breakdown any micro-conversions by high-level metrics or over time to better understand less business-critical user actions.

Ecommerce
Website performance overview
For those selling products via their website, consider providing an overview of your website’s ecommerce performance, breaking down high-level ecommerce data by month, including revenue, transactions, and conversion rates. This will allow you to compare how effective your website is at converting users and generating revenue over time.
Performance by product
Breaking down your best performing products by transactions and revenue, over time, can reveal which products your website users are purchasing the most, and which products are responsible for the most revenue.
Shopping behaviours
Delving further into your users’ shopping behaviours, extracting ecommerce actions from throughout the customer purchasing journey and breaking these down by month, can reveal at which point within a purchasing journey you are losing the most users, and which points within the purchasing journey could be improved upon. Similarly, including actions from the customer checkout process can reveal drop-off points and obstacles for users within the process.
Product List, Category or Promotion Performance
You may want to extract product category, brand or promotion performance data and break this down over time to evaluate your ecommerce performance using a different scope or benchmark your promotional efforts against future efforts.
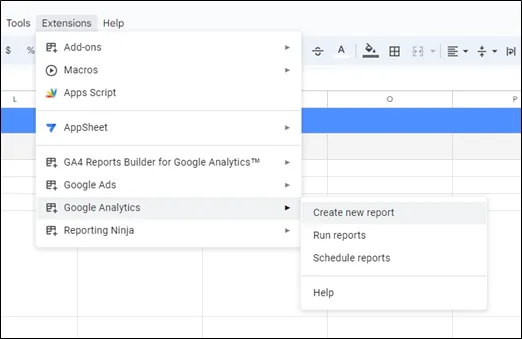
2. Add the Google Analytics extension to Google Sheets
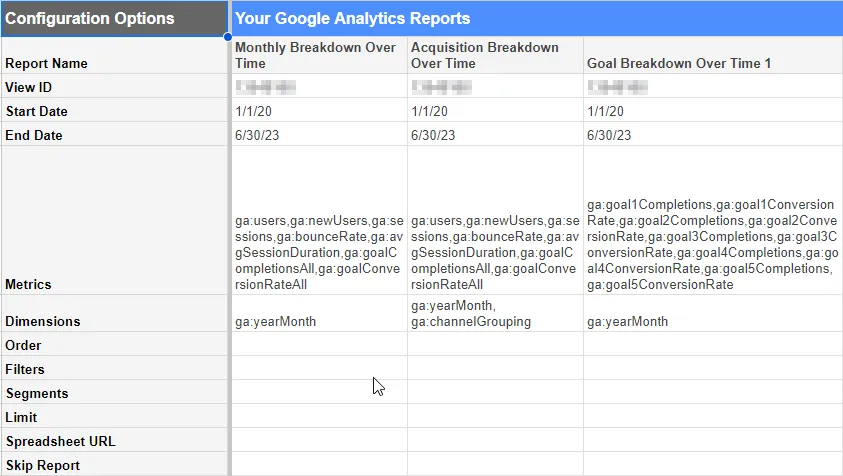
Now that you have decided what data to extract and which reports to create, start with a blank Google Sheets document, and add the Google Analytics extension to it. This neat add-on allows you to select a UA property, and configure reports using your choice of date ranges, metrics, dimensions, segments, and filters.
It’s worth noting that because UA data will be deleted and the UA API shut down from 1st July 2024, this extension will not function beyond that point.
3. Create a Report
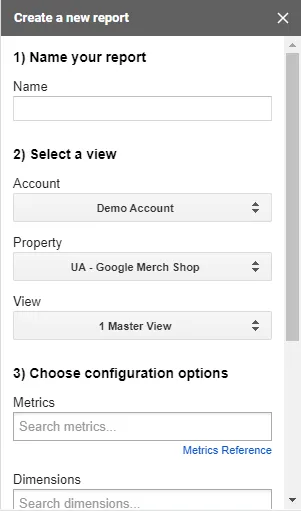
Within the extension, you can now create a selection of reports using your planned list of report attributes for guidance.
Start by naming your report, for example “UA – Website Overview”, and selecting the UA property you wish to pull your data from. Here, you’ll need to select a UA Account, Property, and Property View.
If you don’t see the UA account in the dropdown list, ensure that your Google account has access to that UA account. If you still don’t see the UA account, it’s likely that the access permissions within UA need adjusting to give your Google account a higher level of access. Additional troubleshooting support is available from Google, here.
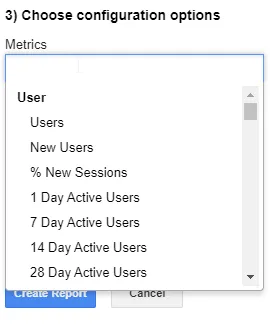
Once you’ve got your report named and UA account selected, you can start adding your choice of report attributes. Under Metrics, you could add Users, Sessions, and Goal Completions. Under Dimensions, you could add Month of the Year. This will give you a report with those Metrics, broken down by month. You can also add Segments, allowing you to segment the data by conditions, like New Users.
Now that you’ve configured these settings, click Create Report.
The extension will now automatically create a “report configuration” worksheet, showing the configuration settings of the report you’ve created, alongside a separate worksheet for the report itself.
Before you dive into the report, cast your eye to the “Start Date” and “End Date” sections of the report configuration worksheet. By default, the extension sets the date range to 1 month, not pulling any data outside of that range. Therefore, change the start date and end date to reflect your choice of date range. As the extension will stop functioning beyond July, we would recommend extracting as much of the available data as possible, so consider expanding this range as far as needed. You’ll need to follow US date formatting for this, MM/DD/YY.
Having done that, you’ll need to re-run the extension. Head to the extension within your toolbar, hover over it and click “Run reports”. This refreshes the reports based on the settings within the report configuration worksheet, pulling data from the new date range.
You have now created your first report, ready to use. For all subsequent reports, simply follow the same procedure.
4. Consider creating a Backup
Your reports are now stored within a single Google Sheets document. Although that Sheet is automatically saved within Google’s highly secure Cloud, consider backing your data up. You could download the unedited reports as an Excel (xlsx) file, and securely store them within a separate cloud storage service, like Microsoft’s OneDrive. Of course, you will not be able to update or change the reports from that new document, but it will ensure that your data is safe if anything happens to your Google account.
5. Utilise your Reports
Using your reports, you can pull valuable data into other worksheets or platforms. For example, you will now be able merge data from different reports into other worksheets using functions like VLOOKUP, or import the data you have extracted into Google Looker Studio by using the report worksheet as a data source, enhancing visualisation and reporting. Looker Studio can interpret the formatting of reports created by the extension without much assistance, but we would recommend cross-checking the original report and the data shown within Looker, to ensure accuracy.
Limitations to Note
This method gives you a high degree of report creation freedom, without any additional costs, striking a comfortable balance between depth and ease of use. However, it does have its limitations.
This method does not allow you to extract the raw data from UA, the unaggregated clickstream data associated with a UA property. BigQuery, combined with an Analytics 360 account, is the method to choose if you require that level of granularity.
Regardless of your data extraction method, time is also a pressing limitation. You will need to allocate time to figure out your reporting needs, plan your data extraction, create your reports, and utilise them elsewhere, and you only have a limited amount of it. That time is likely to be taken away from other tasks, so you will need to keep this in mind when scheduling.
Our expert opinion
For those still relying on UA property data, particularly those without a new analytics solution in place, extracting and preserving UA data before July 2024 will be vital. Whilst Google have provided guidance and a timeline to follow, it will be all too easy to lose track, lose UA access and end up with no data to reference, benchmark against and support decision-making.
When should I extract my UA data?
Now is the time to build a Google Sheet to extract your data. This will give you time to extract, check and utilise the data to give you the insights you need. Do not leave it to the last minute, as it will be too late by the time you notice any errors in your data extraction.
Still need a helping hand?
Our insights experts are on hand to explain this process, extract and preserve data from your UA properties and create reports that provide the valuable information you need.
Why not get in touch today to find out more?