We’re now almost three weeks into the UK’s Coronavirus lockdown. It’s probably safe to say that we’re far from fully adapted to our current circumstances, either as businesses or as individuals. And, of course, more change is coming.
Part of staying agile as a business, and responding to further developments throughout the crisis, involves maintaining a keen focus on market trends and digital performance. That’s why we wanted to share a number of practical actions that you can be taking with your tracking and measurement to help keep abreast of the online changes that will impact your business.
Create Custom Alerts to Notify You of Changing Trends
We’re sure you’re keeping a close eye on your tracking and measurement right now, but with so much change afoot things can slip through the net. That’s where custom alerts can help you.
Configuring custom alerts in Google Analytics or Google Ads will allow you to be notified automatically of any changes that fall outside normal parameters. Maybe the current crisis has created a sudden spike in sales of a particular product. Or perhaps visits to that article you published on ‘working from home’ have gone through the roof. If you hadn’t already noticed these trends, custom alerts could make you aware of them.
More than ever, reacting to changes in how users interact with your business online is vitally important. Whether it’s a promising business opportunity, or a more concerning pattern of behaviour, the first step to addressing these patterns is being aware of them.
What Can Be Tracked With Custom Alerts?
Here are a few examples of things that you can use custom alerts to make you aware of right now:
- No data. After all, the last thing you need right now is a website that’s down or is not tracking
- Spikes or dips in site usage (users, sessions, pageviews)
- Significant changes in conversion numbers or conversion rate
- Changes in ecommerce metrics (revenue, transactions, avg. order value etc.)
- Shifts in PPC metrics (impressions, clicks, CPC etc.)
- Influxes of traffic from new referrers
How to Set Up Custom Alerts in Google Analytics
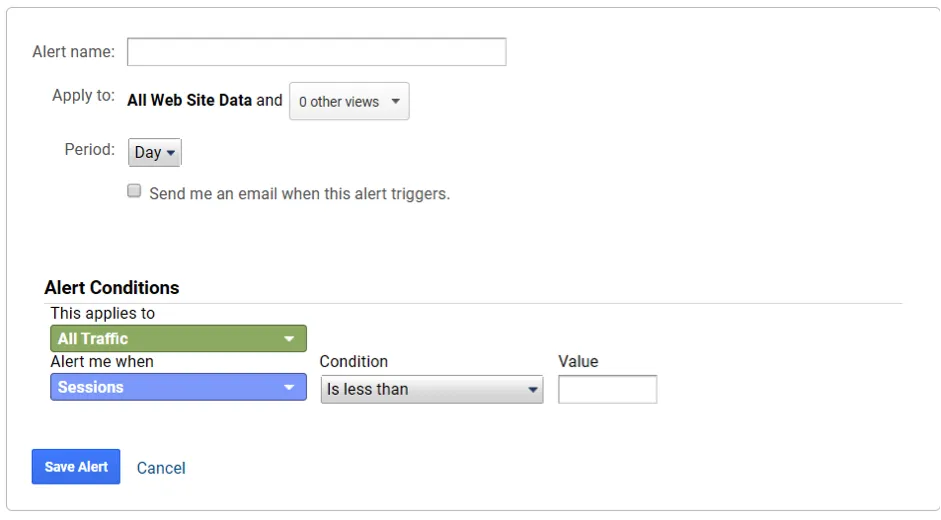
Custom alerts can be found in the Analytics admin panel under the ‘View’ column. Once you’ve hit ‘+ New Alert’ there are a few fields to fill out. Most of them are self-explanatory, but here’s a quick rundown.
Alert name: Make sure you use a descriptive name. Once you’ve got a few alerts going, you want to be able to quickly recognise what each one does at a glance.
Apply to: Here you can select additional views to apply your filter to. Helpfully, you can apply your filter to multiple different websites or Analytics accounts here if you want to.
Period:
This is an important one. This is the time period over which Google Analytics
is observing changes to data, and it will massively impact how effective your
filter is. It also affects the frequency of how often the rule runs. So, if you
set the period to ‘Day’ you could, in theory, receive an alert every single day.
Here, don’t forget to check the box to receive an email when the alert
triggers. If you want to add additional people to receive alerts, you can do so
with the “Also include” option.
Alert conditions: These are parameters that determine when and why your alert will fire. They include:
- ‘This applies to’: Here you can choose all traffic or select a subset of your data. Use ‘Custom Segments’ to select users or sessions from a specific channel, or to create your own dataset (e.g. only sessions in which a user visited a product or service page).
- ‘Alert me when’: Pick the metric you want the rule to be applied to (e.g. sessions or conversions).
- ‘Condition’: This is where you choose the way you measure the change in your chosen metrics, i.e. by meeting a certain threshold or changing by a set number or percentage. If in doubt, choose the percentage option as this doesn’t require you to know your site figures intimately.
- ‘Value’: Input the value for the above condition, e.g. 50%
- ‘Compared to’: If you’ve chosen ‘Day’ or ‘Month’ in your ‘Period’ field, then here you can specify what time period is compared, e.g. month on month or year on year. Consider this carefully. If, for example, you want an alert for when your website traffic drops by more than 50% in a day, make sure you compare this week on week or year on year (not compared to the previous day). Otherwise, there’s a good chance you’ll get an alert every weekend when traffic may naturally dip!

Focus Your Attention on The Data That Matters with Custom Dashboards
In a similar vein to custom alerts, custom dashboards are designed to make you aware of the changes in online performance that impact your business.
Unlike custom alerts, which are usually used to draw your attention to unanticipated changes, dashboards allow you to focus in on the data that you know is important to your business.
Custom dashboards allow you to keep all your most important information organised in one place, without confusion or distraction. This facilitates simpler analysis or reporting that can be more easily digested.
Although Google Analytics and Google Ads each have their own custom dashboards built-in, we’d recommend using Google Data Studio. Data Studio enables you to easily visualise data from multiple sources, for better reporting and comparative analysis.
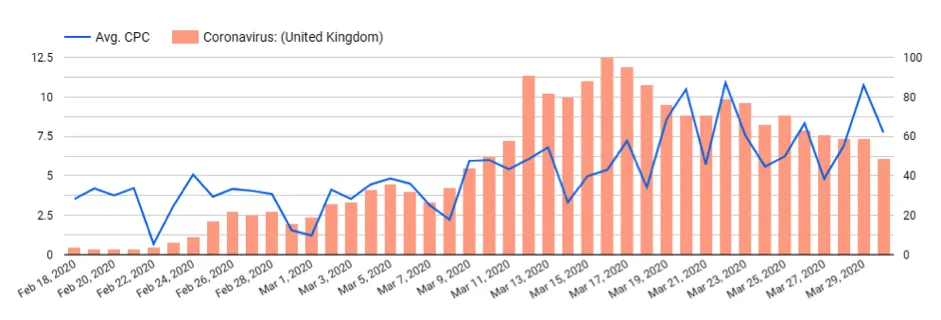
Consider pulling in external data sources to add context to your own data. In the current circumstances, this will allow you to view trends alongside wider industry movement, or simply against the wider impact of Coronavirus. For example, below we’ve used data blending to compare one of our client’s average CPC against the pattern in search for Coronavirus from Google Trends. This rudimentary example clearly indicates a relationship between the crisis and cost per click in this business’ marketplace.

Keep A Record of Big Changes with Annotations in Google Analytics and Google Ads
This suggestion is a simple one, but one you’ll be grateful for in the future. If you’re not already using annotations, then you’re missing out.
Simply put, annotations allow you to keep written notes alongside your data. These notes become invaluable when you later come to analyse reports as they add context to your data. Ever sat there looking at a spike in traffic in Google Analytics that took place last year, and wondered ‘what on earth caused that?’ Added annotations will answer that question for you.
Examples of good reasons to use an annotation include:
- Significant website updates, e.g. new product range launches or content expansion
- Website or tracking downtime
- Marketing campaign activity or events
- Google core algorithm updates
How to add annotations in Google Analytics or Google Ads
In Google Analytics annotations are surprisingly well hidden. I’ve met people who’ve used Analytics for years and been completely unaware of the whereabouts of this handy little function.
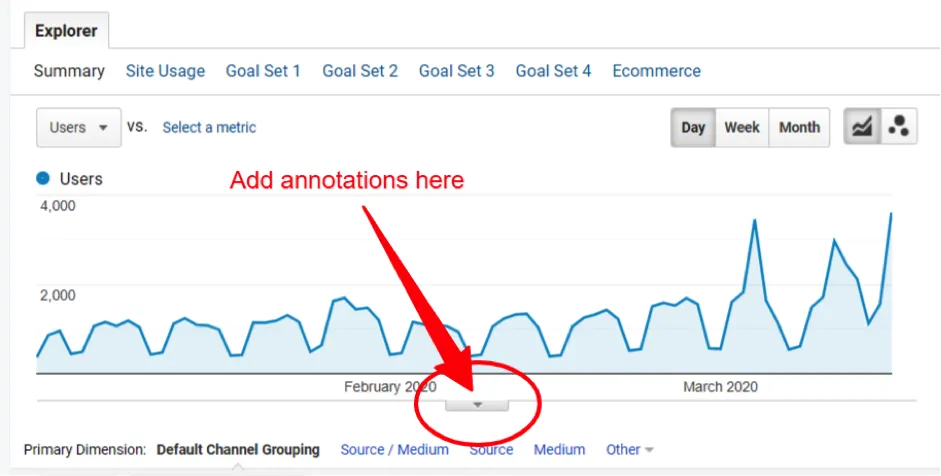
Annotations can be added in Google Analytics reports that have an ‘Explorer’ view; basically any that have a graph at the top. Click on the arrow beneath the chart (highlighted below) and simply select ‘+ Create new annotation’. From there you can choose the date, add a description and decide who can see the annotation. You can also ‘star’ your annotations to highlight notes of higher importance and filter to only these.

Slightly late to the game, Google Ads only gained an annotations feature in May 2018, so not everyone is aware it even exists.
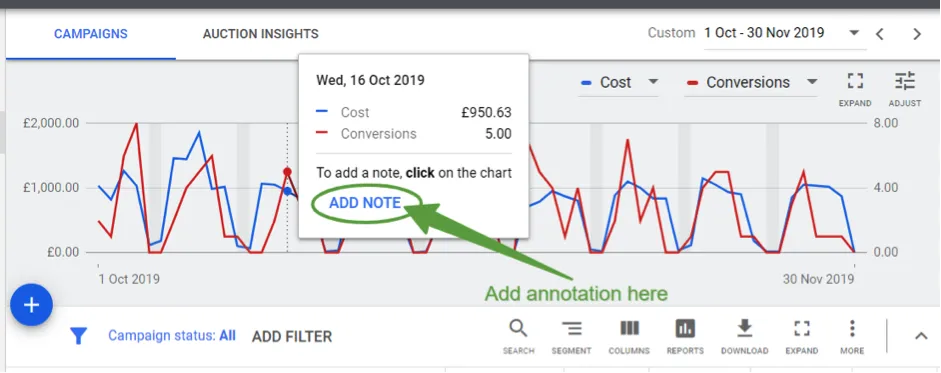
Simply called ‘notes’ in Google Ads, they are, at least, slightly more intuitive to add. Again, you must be in a report that displays a chart, but once you’re there simply hover over a data point on the chart and click ‘add note’ in the dialogue box that appears. Make sure you’ve got the right date, add your description, and away you go.

Some Key UK Coronavirus Dates to Consider for Annotations
- Wednesday 11 March 2020 – Covid-19 declared a pandemic by WHO
- Monday 16 March 2020 – Covid-19 soft lock down begins (Boris Johnson advises the British public to avoid public places and work from home where possible)
- Monday 23 March 2020 – Covid-19 hard lockdown begins
Are You Sure Your Analytics Data is Accurate?
Underpinning all your analysis and reporting should be solid data. Google Analytics will never be 100% accurate, but we recommend you do everything in your power to make sure that what you’re seeing reflects reality. When the future is as uncertain as it is right now, clarity in your reporting is all the more important.
If you haven’t done one recently, now may be a good time to give your analytics and tracking a once over. For example, are your IP filters up-to-date or are all your staff working from home skewing your data? Are your channel groupings accurate or is some organic traffic being reported as referral? Are those timely social or email campaigns being tracked correctly?
If you’re in any doubt that your tracking is up to scratch, feel free to get in touch.


